The recovery is uneven.
Arrivals passed their 2019 level, but 2025 was weaker than 2024. Paid nights lagged both years. Real production in accommodation and food services also fell from 2024, while staying above 2019.
Tourism / research & policy · updated 7 October 2026
Arrivals recovered. Paid nights lagged. Real production rose. What does that mean for people living here?
Our completed research follows the recovery from visitor counts to production and resident income. It explains what the numbers can tell us—and what Saint Lucia needs to measure next.

01 / The answer in a minute
Saint Lucia welcomed slightly more stay-over visitors in 2025 than in 2019. Published paid nights were lower. Yet the real value added by accommodation and food services was higher. All three can be true.
Published annual record
Stay-over arrivals
+0.7%423,736 → 426,676 visitorsPublished paid nights
−13.6%2.79m → 2.41m person-nightsReal accommodation & food-services value added
+9.7%EC$1,160.6m → EC$1,273.7m · 2018 pricesArrivals passed their 2019 level, but 2025 was weaker than 2024. Paid nights lagged both years. Real production in accommodation and food services also fell from 2024, while staying above 2019.
The retrieved public record does not identify a reliable national growth rate for tourism income reaching residents. More spending, more production and more household buying power are different claims.
Keep arrivals and nights. Add a clear account of resident earnings, production and public costs. Tie support to additional resident benefit and reliable services, with review dates.
[paper] [esr] Paper evidence cutoff: 6 October 2026. Later 2026 releases are not silently added to this record.
What changed in this update? The research verifies the post’s 2019 arrival total from an official Finance table. It also adds the real-production comparison above, replaces the claim-based calculator with an official-data starting point, and sets out a staged measurement programme.
02 / The UWP post, line by line
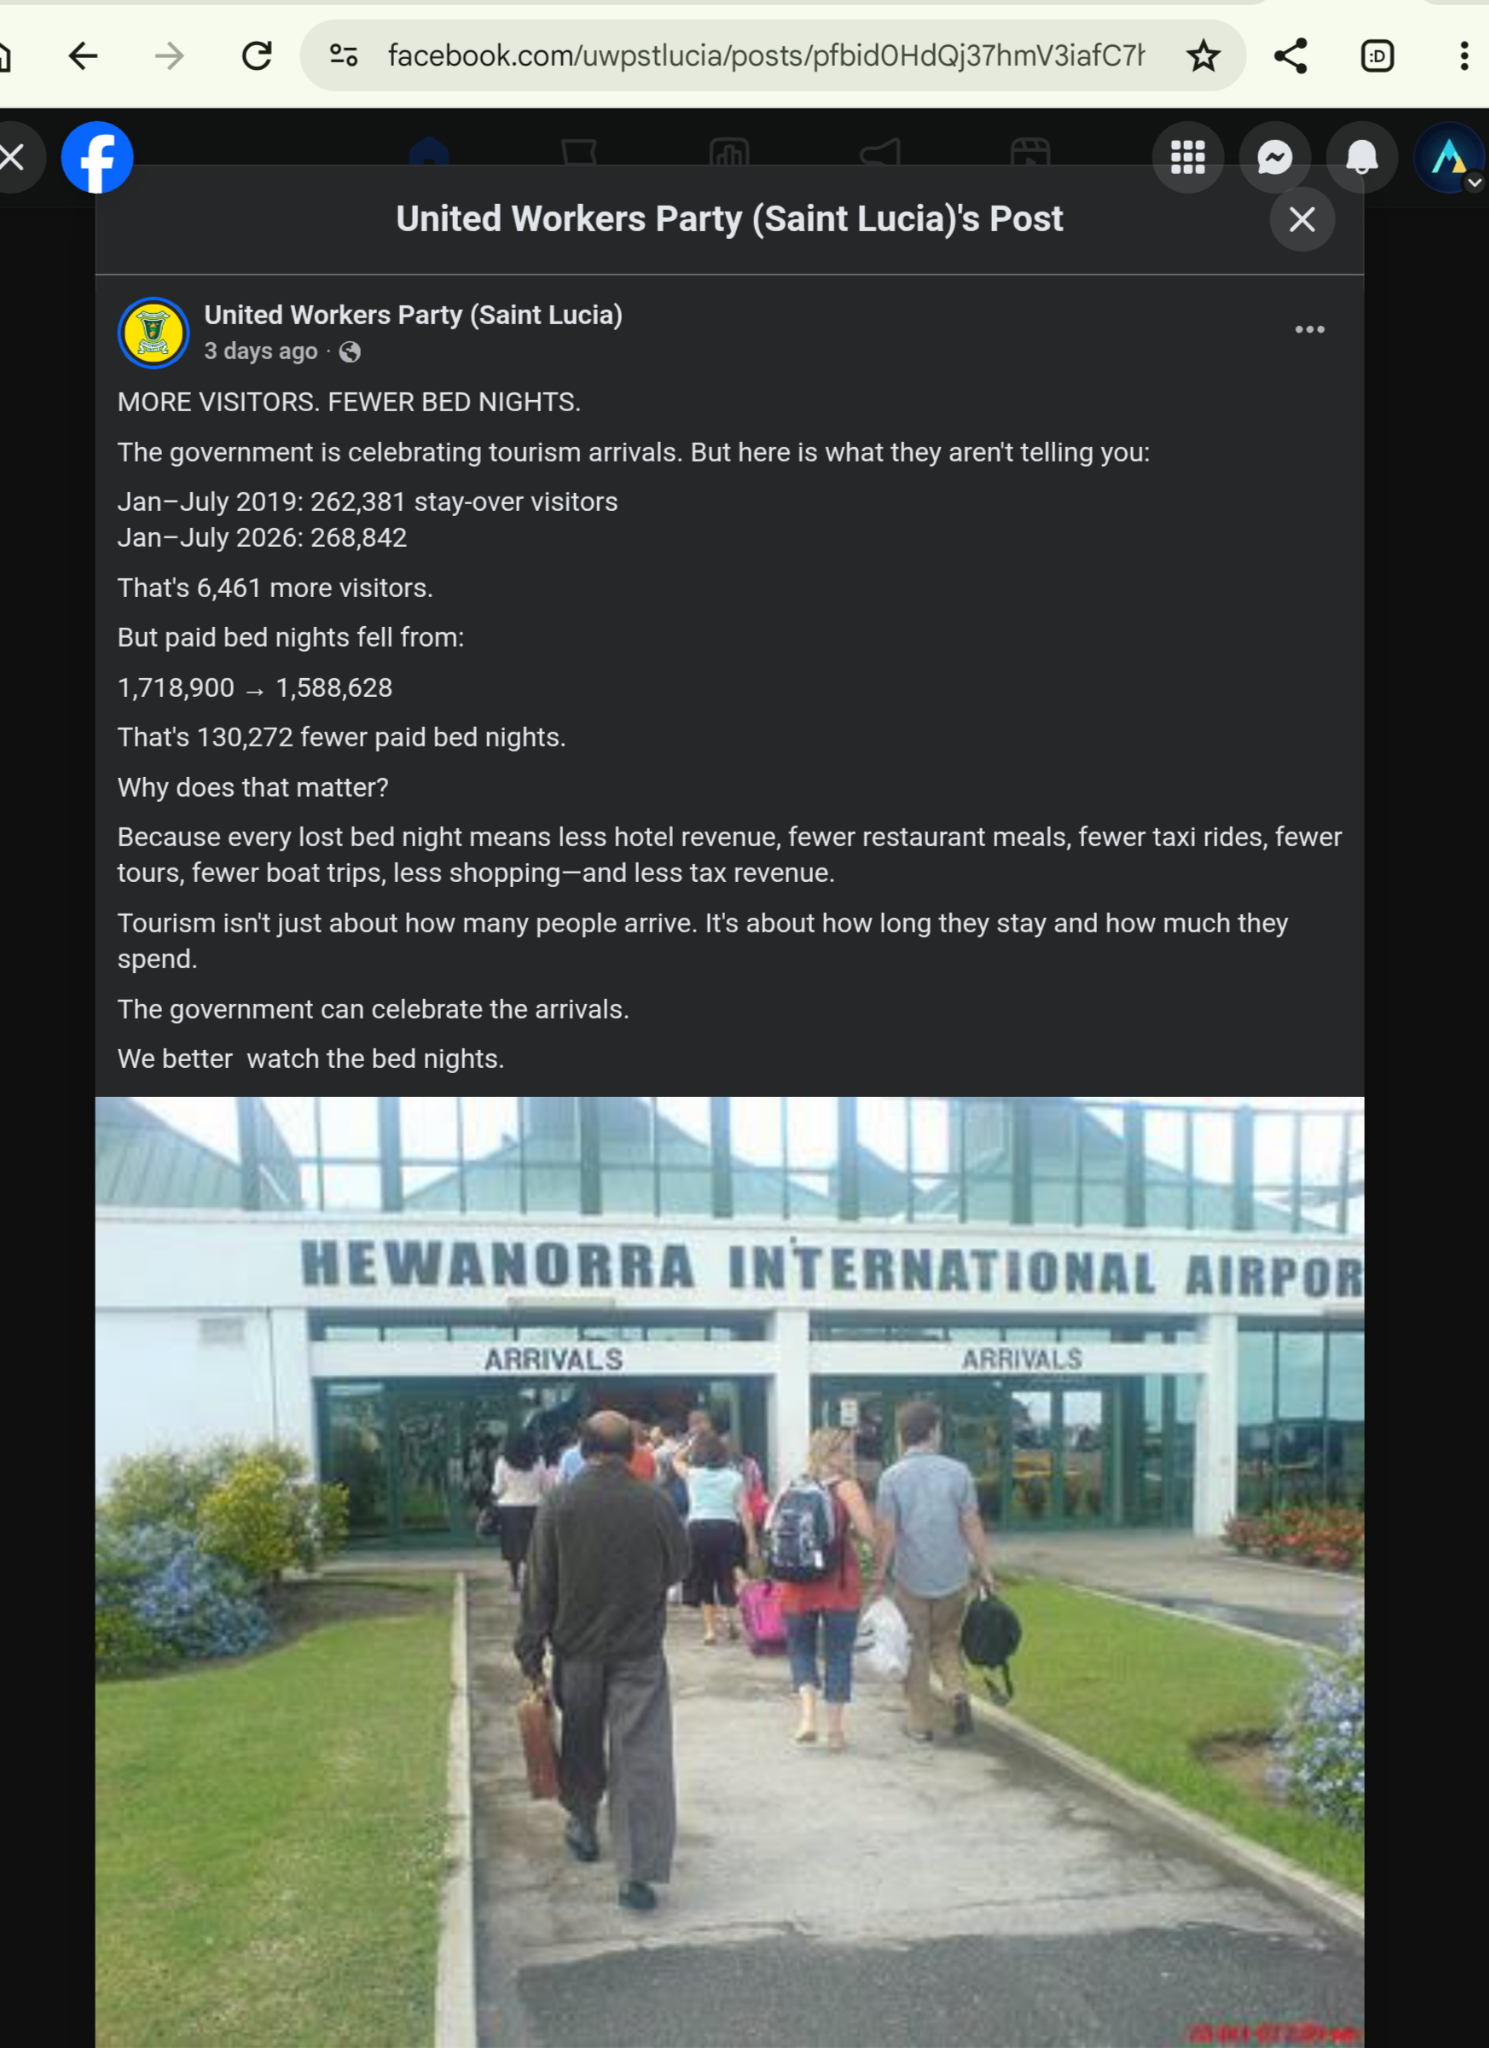
The supplied screenshot is headed “MORE VISITORS. FEWER BED NIGHTS.” It is attributed to the United Workers Party (Saint Lucia). It compares January–July 2019 with January–July 2026, then argues that every lost paid night means lower revenue across visitor businesses and taxes. [post]
| Post’s claim | Our check | Evidence status |
|---|---|---|
| 2019 stayovers: 262,381 | Verified by summing January–July in ESR 2023, Table 6. The reconciled series also matches the annual total. | Verified official total |
| 2026 stayovers: 268,842 | No matching primary January–July release located. We have not relabelled it as 2025. | Unverified |
| Paid nights: 1,718,900 → 1,588,628 | No primary table located for these exact seven-month totals. Coverage and timing need confirmation. | Both endpoints unverified |
| +6,461 arrivals; −130,272 nights | The subtraction is right. The corresponding changes are +2.46% and −7.58%. | Arithmetic only |
| Every lost night means less of every kind of revenue | Too absolute. Prices, visitor mix, purchases per trip, local sourcing and tax rules also matter. | Inference not established |
262,381 to 268,842
1,718,900 to 1,588,628
January–July 2019 versus January–July 2026. These are calculations from the post, not independently verified changes.
The screenshot shows a relative timestamp and a truncated Facebook address. We have not authenticated the original permalink or inferred a publication date from “3 days ago.” It establishes what the supplied statement says.
The older CSO monthly page gives July 2019 as 42,778. ESR 2023, Table 6, gives 42,773 and reconciles to the annual total of 423,736. Its January–July sum is 262,381. The paper preserves the conflicting older series and explains the choice. An older digest also has a March inconsistency. This is why public releases need a clear record of revisions.
03 / Why those years?
Chastanet led the UWP government in 2019; Dominic Fedee was tourism minister. In the 2026 official releases reviewed here, Philip J. Pierre is Prime Minister and Ernest Hilaire holds the tourism portfolio. Naming the administrations is useful context. It does not identify their separate contribution to the numbers. [chastanet] [2019release] [water] [april]
2019 was the last full year before COVID-19 disrupted international travel. It is a sensible recovery benchmark. Comparing the same seven months also avoids the obvious error of comparing a partial year with a full year.
A comparison with Chastanet’s pre-pandemic year is politically useful to the UWP. That is an interpretation of the framing, not proof of why the author chose it. The post does not explain its selection.
For a fair assessment, add the same months of the previous year and the recent peak. Account for flight capacity, prices, source markets, accommodation supply, visitor purpose and statistical revisions. A two-date comparison cannot isolate a Prime Minister’s effect.
Has activity regained its pre-pandemic level?
Is it improving on the same months last year?
Has it regained the recent arrival peak?
Are gains reaching workers, firms and communities?
04 / What the official record actually shows
Full calendar years · each selected baseline = 100
2025 against 2019: arrivals 0.7%; paid nights -13.6%.
SLPA calculations from ESR 2025, Table 5. Night totals are rounded to 0.01 million, so index changes are approximate. The 2025 published bed-night change is −6.7%; calculating from its rounded levels gives −6.6%. These annual results do not authenticate the post’s January–July 2026 figures.
| Year | Stay-over arrivals | Paid nights, millions |
|---|---|---|
| 2019 (revised) | 423,736 | 2.79 |
| 2020 | 130,781 | 1.04 |
| 2021 | 199,347 | 1.60 |
| 2022 | 356,237 | 2.57 |
| 2023 | 380,791 | 2.44 |
| 2024 (revised) | 435,659 | 2.58 |
| 2025 (preliminary) | 426,676 | 2.41 |
Against 2024, stayovers fell 2.1%, paid nights 6.7% and estimated visitor spending before inflation 4.7%. Real accommodation-and-food-services value added fell 4.9%. So the recent slowdown is visible in several measures. [esr] [paper]
Against 2019, the picture changes: arrivals were 0.7% higher and real industry value added was 9.7% higher, despite about 13.6% fewer published paid nights. That is evidence against treating every lost night as proof of lower domestic production. It still does not settle residents’ income gains.
The SLTA’s 1 June release reported 40,752 April stayovers, up 8.5% on April 2025, with January–April up 3.7%. It quoted Hilaire positively and acknowledged a fall in UK visitors. This supports saying official communications celebrated specific gains. [april]
It does not establish a full-year boom, record paid nights or higher resident income. A good April and a longer-run paid-night shortfall can coexist.
| January–July | Stayovers | Status |
|---|---|---|
| 2019 | 262,381 | Verified: ESR 2023 Table 6 |
| 2023 | 234,424 | Official monthly sum |
| 2024 | 274,094 | Official monthly sum |
| 2025 | 263,394 | Official monthly sum |
| 2026 | 268,842 | Post’s claim; unverified |
If 268,842 is confirmed on the same basis, it would be 2.1% above 2025 and 1.9% below 2024. That is recovery from a softer year, still below a recent peak. These conditional comparisons show why one baseline is insufficient. [esr] [esr2023] [post]
We use ESR 2025 Tables 5–6 consistently for the official annual and recent monthly series. Its 2019 and 2024 annual columns are revised; 2025 is preliminary. An older CSO page differs on 2023 paid nights and 2019 average stay. We have not combined those vintages.
The review itself publishes the weakness. Its detailed text and Table 5 report a 6.7% paid-night fall; its summary says 6.8%. Rounded annual levels produce about 6.6%. These are disclosure and reconciliation issues, not evidence of concealment. The narrow conclusion is that promotional headlines should show the wider scorecard. We cannot establish deliberate withholding from this post. [esr] [cso]
We did not substitute a July value inferred from first-half totals for an observed result. Nor did we join all-category arrival totals with different treatment of excursionists.
Download the source-labelled monthly data
05 / Understanding the metric
A guest spending one night creates one guest night, often called a bed night. Paid nights count nights in the paid accommodation covered by the measure. They are an established tool for understanding accommodation demand; Saint Lucia publishes them and the IMF discusses their role in measuring accommodation output. [irts] [imfvolume]
A room rate belongs with room nights. A per-person-night yield belongs with guest nights. Mixing them creates a wrong revenue estimate.
The official annual figures give about 6.58 published paid nights per arrival in 2019 and 5.65 in 2025. This ratio mixes all arrivals with only the paid nights being counted. Some arrivals stay with relatives, use several kinds of accommodation or stay outside the reporting frame. Calling it “average trip length” would be misleading. [paper]
Saint Lucia’s 2016 review explicitly discussed unpaid accommodation as a factor in paid-night changes. That establishes the issue historically; it does not confirm the current collection method. [historic]
Guests might stay fewer nights in the same properties. More visitors might use unpaid accommodation. Market mix or the reporting frame might change. Rentals may be fully covered, partly covered or missed, depending on the source. The post cannot distinguish these possibilities.
Match the people, property types and dates first. A July arrival leaving in August can be assigned differently in an arrivals cohort and a calendar-night series. A genuine average requires a compatible numerator and denominator.
An accounting identity only when definitions, timing and coverage match. The required share and duration are not independently measured by the post.
A shorter trip can reduce the opportunity to buy meals and tours. That makes the concern worth investigating. But an airport transfer is often bought per trip: more arriving parties can mean more transfers even when total nights fall. Visitors can spend more per day, purchase different products or use different businesses. Hotel revenue can change through prices and room-sharing as well as nights. Tax receipts also depend on rates, exemptions, compliance and the kind of spending.
So a fall in comparable paid nights signals weaker measured accommodation volume. It does not prove that taxis, boats, shops, restaurants, hotel revenue and tax receipts all fell together.
Where the night decline appears · 2019 → 2025
The paper divides the change between these two factors, sharing their interaction equally. These are approximate accounting contributions from rounded night totals, not estimates of causes. The second part could include stay length, accommodation use, market mix, reporting or timing. It does not prove that trips became shorter. [paper]

06 / From tourism activity to living standards
The development goal is rising real incomes, capable local firms and reliable public services. Arrivals and paid nights are useful inputs to that goal. They are not substitutes for it.
Who came, where they stayed and for how long?
What did they buy, at what price, and where was payment received?
How much value was created inside Saint Lucia after purchased inputs?
What reached resident workers and owners, and what did public services cost?
Our earlier retained-value analysis and tourism-dollar research model ask how visitor spending becomes local income and capacity. The EC$0.55 central case in that work is an assumption-based model. It is not a measured current retention rate. The completed paper keeps that assumption separate from its findings. [slpa] [michel]
A foreign-owned hotel operating as a resident enterprise can create domestic value added: wages, operating surplus and associated production. Income payable to non-resident owners affects the national-income account; it does not erase that production from GDP. “Resident” is an accounting concept, not a synonym for citizenship. [tsa] [bpm]
Local procurement is also not wholly local value added. An imported bottle sold by a local shop contains foreign production. Adding a supplier’s full turnover to the wages and profits already contained within it counts the same value twice. Imported inputs, overseas booking services and income accruing to non-resident owners belong at different steps in the account; subtracting one flow twice also gives a wrong answer.
The IMF/CARTAC review identified visitor-survey weaknesses and a 2023 mirror-data exercise suggesting expenditure could be overstated by as much as 14%. This is a warning about measurement, not permission to cut every tourism spending figure by 14%. Sampling design and who responds matter. [imfsurvey]
Higher prices can lift receipts without increasing services delivered or workers’ living standards. More survey responses may reduce random error while still missing the same visitor groups. The paper’s simulated survey tests show why coverage and response patterns need checking, alongside sample size.
Try the assumptions · 2019 → 2025
Fewer paid nights do not tell us whether residents earned more. Use this tool to see what else would need to change. Start with a sample scenario, then move the sliders.
These two starting facts come from the paper’s official-data inputs. The changes below are assumptions. The 2025 tourism data are preliminary; night totals are rounded.
Scenario result · not a national estimate
In this scenario, the paid-stayer income component is below its 2019 level.
Spending per night 0.0%; income per dollar 0.0%; reporting factor 0.0%; household-price adjustment on.
This models one direct paid-stayer income component. It does not estimate total tourism income, household income across Saint Lucia, or the effect of any government policy.
More spending can offset fewer nights. It may still fail to raise purchasing power if prices rise or less income reaches residents from each dollar spent. The reporting factor can also change the conclusion. None of those unknown changes is measured by this tool.
Income ratio = (2.41 ÷ 2.79) × spending-per-night ratio × resident-income-per-dollar ratio ÷ reporting-factor ratio ÷ household-price ratio. All slider values are relative changes, not percentage-point changes in a national retention rate.
The paper separates the income-per-dollar term into domestic value added per visitor dollar and the share accruing to residents. This compact tool combines them. It assumes compatible visitor groups and periods, feasible positive factors and the paper’s multiplicative measurement model. Household CPI concerns buying power, not tourism production volume.
Other visitor groups, indirect effects, public costs, taxes and transfers, and the distribution of income are outside this component. We do not divide total visitor spending by paid nights to fill the spending control: the populations do not match. See the paper, §§5.3–6.3.
07 / A practical national response
These are SLPA recommendations. The timetable starts when the programme is funded; it is not a list of Government commitments. The CSO should lead the statistical work, with Tourism, SLTA, Finance and the custodians of each dataset. [paper]
| When | Proposed lead | Publish or deliver | Decision it enables |
|---|---|---|---|
| 30 days | CSO and Tourism Permanent Secretary; Finance convenes | Common definitions, a source list, a revision and correction process, and a signed legal review of collection and sharing powers. | Identify valid comparisons. Reconcile the disputed endpoints or leave them openly unresolved. |
| 90 days | CSO/SLTA research leads and accommodation-register custodian | A reconciled accommodation frame and a comparison departure-survey pilot, with nonresponse logs and actual staff time and costs. | Separate changes in coverage from changes among consistently reported operators. Choose the next useful measurement. |
| 180 days | CSO national-accounts and external-sector teams; Finance and authorized custodians | An experimental spending-to-production account, a workforce-coverage audit and a test of whether incentives can be linked lawfully to outcomes. | Check the income account and authorize bounded policy trials with a credible evaluation. |
| 365 days | Finance and Tourism accounting officers; CSO technical signoff | An annual reconciliation pack, independent reproduction, actual collection costs and explicit keep/change/stop decisions. | Expand useful collection, end duplication and fund the next cycle. |
Keep the burden small. Ask businesses for a fact once. Use secure administrative records where lawful, keep the monthly return short, and rotate detailed questions. Include small guesthouses in the burden test. Keep identifiable records with authorized custodians; release checked aggregates that protect people and firms.
The Tourism Development Act provides relevant institutional machinery. The paper does not certify the full legal position following the June 2026 amendment bill. The first stage must confirm current powers, commencement and sharing rules. Its collection-cost scenarios are hypothetical, not an approved CSO budget. [paper]
CSO and Tourism should publish a bridge between the old and new reporting frames. A rental-platform listing alone does not prove an active property or a completed stay.
SLTA and providers should compare the trial with a credible alternative. Count discount costs, visits displaced from other periods, additional spending, worker and supplier outcomes, and service pressure. Set an expiry and review date before launch.
CSO, Labour and Finance should strengthen the missing income measures. Agriculture, Commerce and Tourism can test local supply support through fulfilled contracts, prompt payment, supplier net earnings and domestic value added. Gross sales and supplier registrations are not enough.
Finance and Tourism should disclose the legal basis, purpose, actual use, benchmark tax expenditure and feasible alternatives. A count of concession orders does not measure fiscal cost or jobs caused. Preserve lawful commitments while testing whether new support adds benefit beyond what would have happened anyway.
Tourism, planning authorities and utilities should attach water, waste, access and other service requirements to expansion. Check outcomes for communities as well as visitor businesses. This paper does not estimate tourism’s causal contribution to household service problems.
Water is a current operating constraint, not an abstract afterthought: Pierre’s March 2026 meeting with tourism stakeholders addressed dry-season supply difficulties. New rooms and more nights require a service plan for residents and visitors together. The announcement does not establish that the proposed remedies have been delivered. [water]
| Measure | Why it belongs | Required companion |
|---|---|---|
| Arrivals and visitor nights | Demand and duration | Market, purpose, paid/unpaid split |
| Room nights and occupancy | Accommodation use | Available capacity and reporting frame |
| Spending and yield | Receipts and pricing | Survey quality, compatible units, price basis |
| Real earnings and resident income | Household gains | Hours, distribution, residency definitions |
| Local production and procurement | Supplier capability | Import content, margins, repeat contracts |
| Fiscal and service account | Public return and capacity | Support cost, water, waste, housing, resilience |

08 / SLPA’s decision discipline
Destination marketing, route coordination and predictable investment rules serve real functions. Improve evidence and condition new support without abruptly removing those functions. A ready pilot needs lawful authority, staff, data agreements, funding and an evaluation owner.
Begin with a bounded survey and supplier pilot. Preserve resident water access, fiscal resilience and public coastal access as floors. Expand only after verified additional benefit; stop or redesign if the data fail or costs breach the agreed limits. Statistical and supplier skills remain useful even if a pilot fails.
Visits, nights, business receipts and public support change.
Firms alter prices, hiring, sourcing and property use.
Income, imports, housing, transport and water feel the change.
Skills, ownership, debt and coastal exposure shape future choices.
These are pathways to test, not forecasts. More nights could deepen local capability or overload services. The delivery plan must watch both.
Denominator Integrity: paid nights and all arrivals need matched coverage. Update Symmetry: demand comparable evidence from Government and opposition. Causal Contribution–Responsibility Separation: name accountable ministers without treating their tenure as proof of causal impact.
This is an applied reasoning record, not a numerical Logic Engine score or a claim of certification.
An authenticated January–July release could verify or correct the three remaining disputed endpoints. Matched accommodation data could identify whether duration or mix explains the night change. Better income and price data could show real resident gains even with fewer paid nights, or reveal weaker gains despite more arrivals. Policy should update in either direction.
A rule for reporting and action
State the measure, period and assumptions.
Investigate the source and test a response.
Collect the missing observation most likely to change the decision.
These are evidence-based or assumption-bounded ranges, not automatically statistical confidence intervals. The page’s scenario tool shows individual possibilities, not an estimated national range. While the case is unresolved, prefer small, reversible trials with service conditions and review dates. Expand support only when additional resident benefit is demonstrated against a feasible alternative.
PITONS gives this programme a public decision record: name the owner, state what success requires, publish what happened and explain the keep/change/stop choice. Alongside IIR, SOT and RIPPLE-4, it disciplines the work; it does not certify an economic effect.
09 / Evidence you can inspect
The completed paper audits the literature, reconciles 132 monthly arrival observations for 2015–2025, and constructs a common-vintage annual visitor record for 2011–2025. Its contribution is an audited Saint Lucia application and an executable measurement protocol. It does not claim a new decomposition theorem, a current measured retention rate or a causal estimate for a Prime Minister or policy.
The PDF contains the methods, proofs, complete inputs, reproducible code, references and source audit. The main findings use official observations; the political claims and synthetic experiments stay separate. No contact with the UWP, Government or private businesses is implied.
Canonical research paper, 6 October 2026. DOI 10.5281/zenodo.23197449. Methods, proofs, executed results, complete inputs and source/revision audit. Evidence cutoff: 6 October 2026.
Government of Saint Lucia. Appendix Table 6, printed p.108. Reconciled monthly 2019 series authenticates 262,381 January–July arrivals and the annual total.
Presented 17 June 2026, p.4; activities and advocacy pp.29–34. Uploaded copy matched the public download. Industry-association account, not a January–July 2026 statistical release.
Primary evidence of the supplied statement. Original permalink and publication date not independently recovered; figures are claims until corroborated.
Government of Saint Lucia. Appendix Tables 2 and 5–6; Table 5 printed p.104; discussion pp.24–26. Real accommodation-and-food-services GVA uses 2018 prices. Annual data; 2024 revised, 2025 preliminary. Rounded bed-night levels.
January–July 2019 stay-over series has a five-visitor difference from the contemporaneous SLTA July release. Reconciled in the paper using ESR 2023 Table 6; the 2019 arrival claim is verified.
Secondary host of SLTA-attributed monthly data, including the historical 2019 series. Attribution is not the same as retrieving an original SLTA table.
GIS, 26 September 2019. Reports 42,773 stayovers in July and names Dominic Fedee.
SLTA, 1 June 2026. April and January–April comparisons; not January–July or a full-year result.
SLTA, 20 January 2020. Arrival promotion under Dominic Fedee also discussed bed nights, employment and income.
Office of the Prime Minister, 12 February 2019. Identifies Allen Chastanet as Prime Minister.
OPM, 5 March 2026. Philip J. Pierre; water constraints and proposed responses. Announced measures are not proof of completed delivery.
United Nations, paragraphs 2.75–2.76 and 6.32–6.33: duration, nights and accommodation coverage.
Printed p.13, footnote 2. Explains paid-night estimation and the role of private/unpaid accommodation. Historical methodology, not confirmation of the 2026 method.
Accommodation volume, bed nights and composition. Mission conducted in 2022; published in 2023.
Visitor expenditure survey and 2023 mirror-data diagnostic, paragraphs 19–22 and Appendix VI. Its 14% diagnostic discrepancy estimate is not a general correction factor.
Direct tourism value added, supply–demand reconciliation and boundaries of the satellite account.
Chapter 11: primary income. Domestic production and income accruing to residents are distinct accounts.
Older publication vintage. Has different 2023 paid nights and 2019 stay length from ESR 2025; not spliced into the annual chart.
Historical TSA and supply-use foundations, not current measured retention coefficients.
Earlier SLPA policy model. Its retention ratios are illustrative assumptions, not official tourism statistics.
Kevin L. Michel research model. This article keeps production, resident income and public costs separate.
Research and writing were assisted by AI. Primary-source checks and the executed calculation files define the evidential basis. No new retention estimate is claimed.