A 2024 regional assessment reported 98% supply coverage, but only 60% of customers with 24-hour service in the dry season. The underlying data are mostly from 2020–23, not a live 2026 audit.
SourceExperimental public explainerEvidence through 27 August 2026
From rain
to tap.
Saint Lucia can receive heavy rain and still have dry taps. Reliable water is a chain of watersheds, infrastructure, people, finance and rules.
Understand it in 90 seconds Stress-test the system Open the national plan Explore tariffs and household costs
- Natural input
- Rainfall, rivers, soils and local groundwater
- Managed service
- Intakes, treatment, storage, pipes and operations
- Public result
- Safe, affordable and dependable water at the point of use

01 Water in a minute
Rain is the first link. The tap is the last.
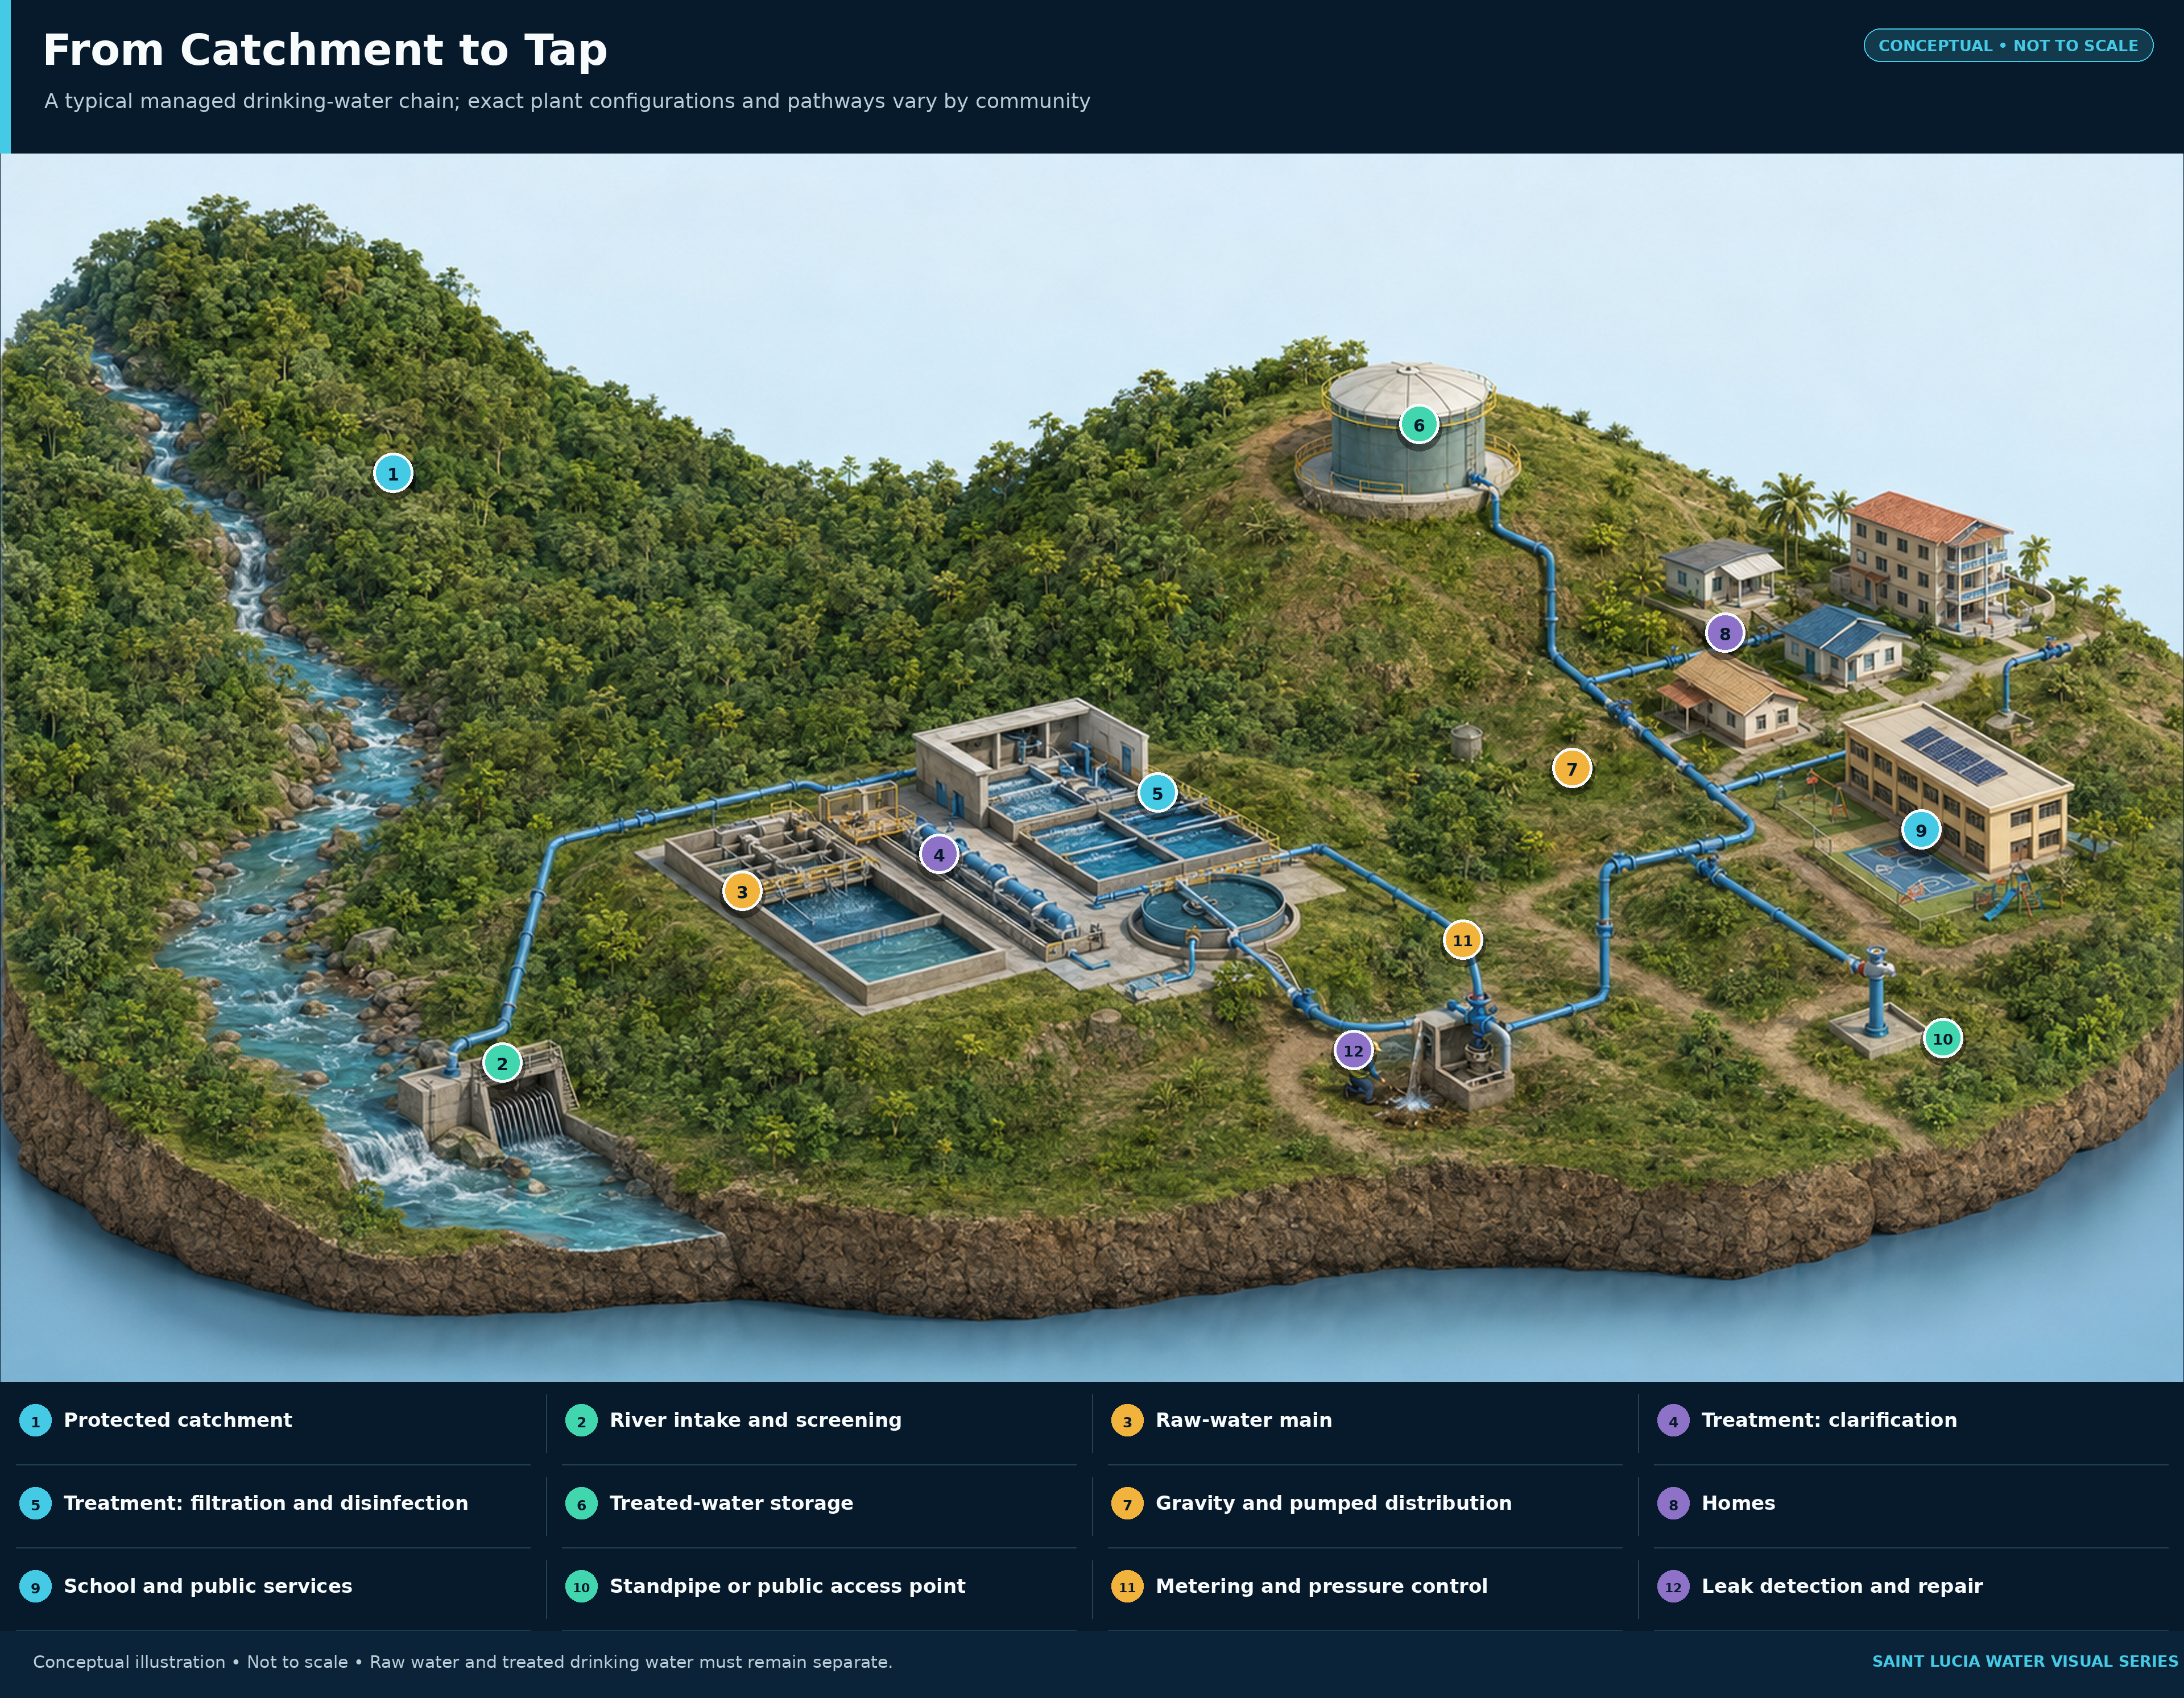
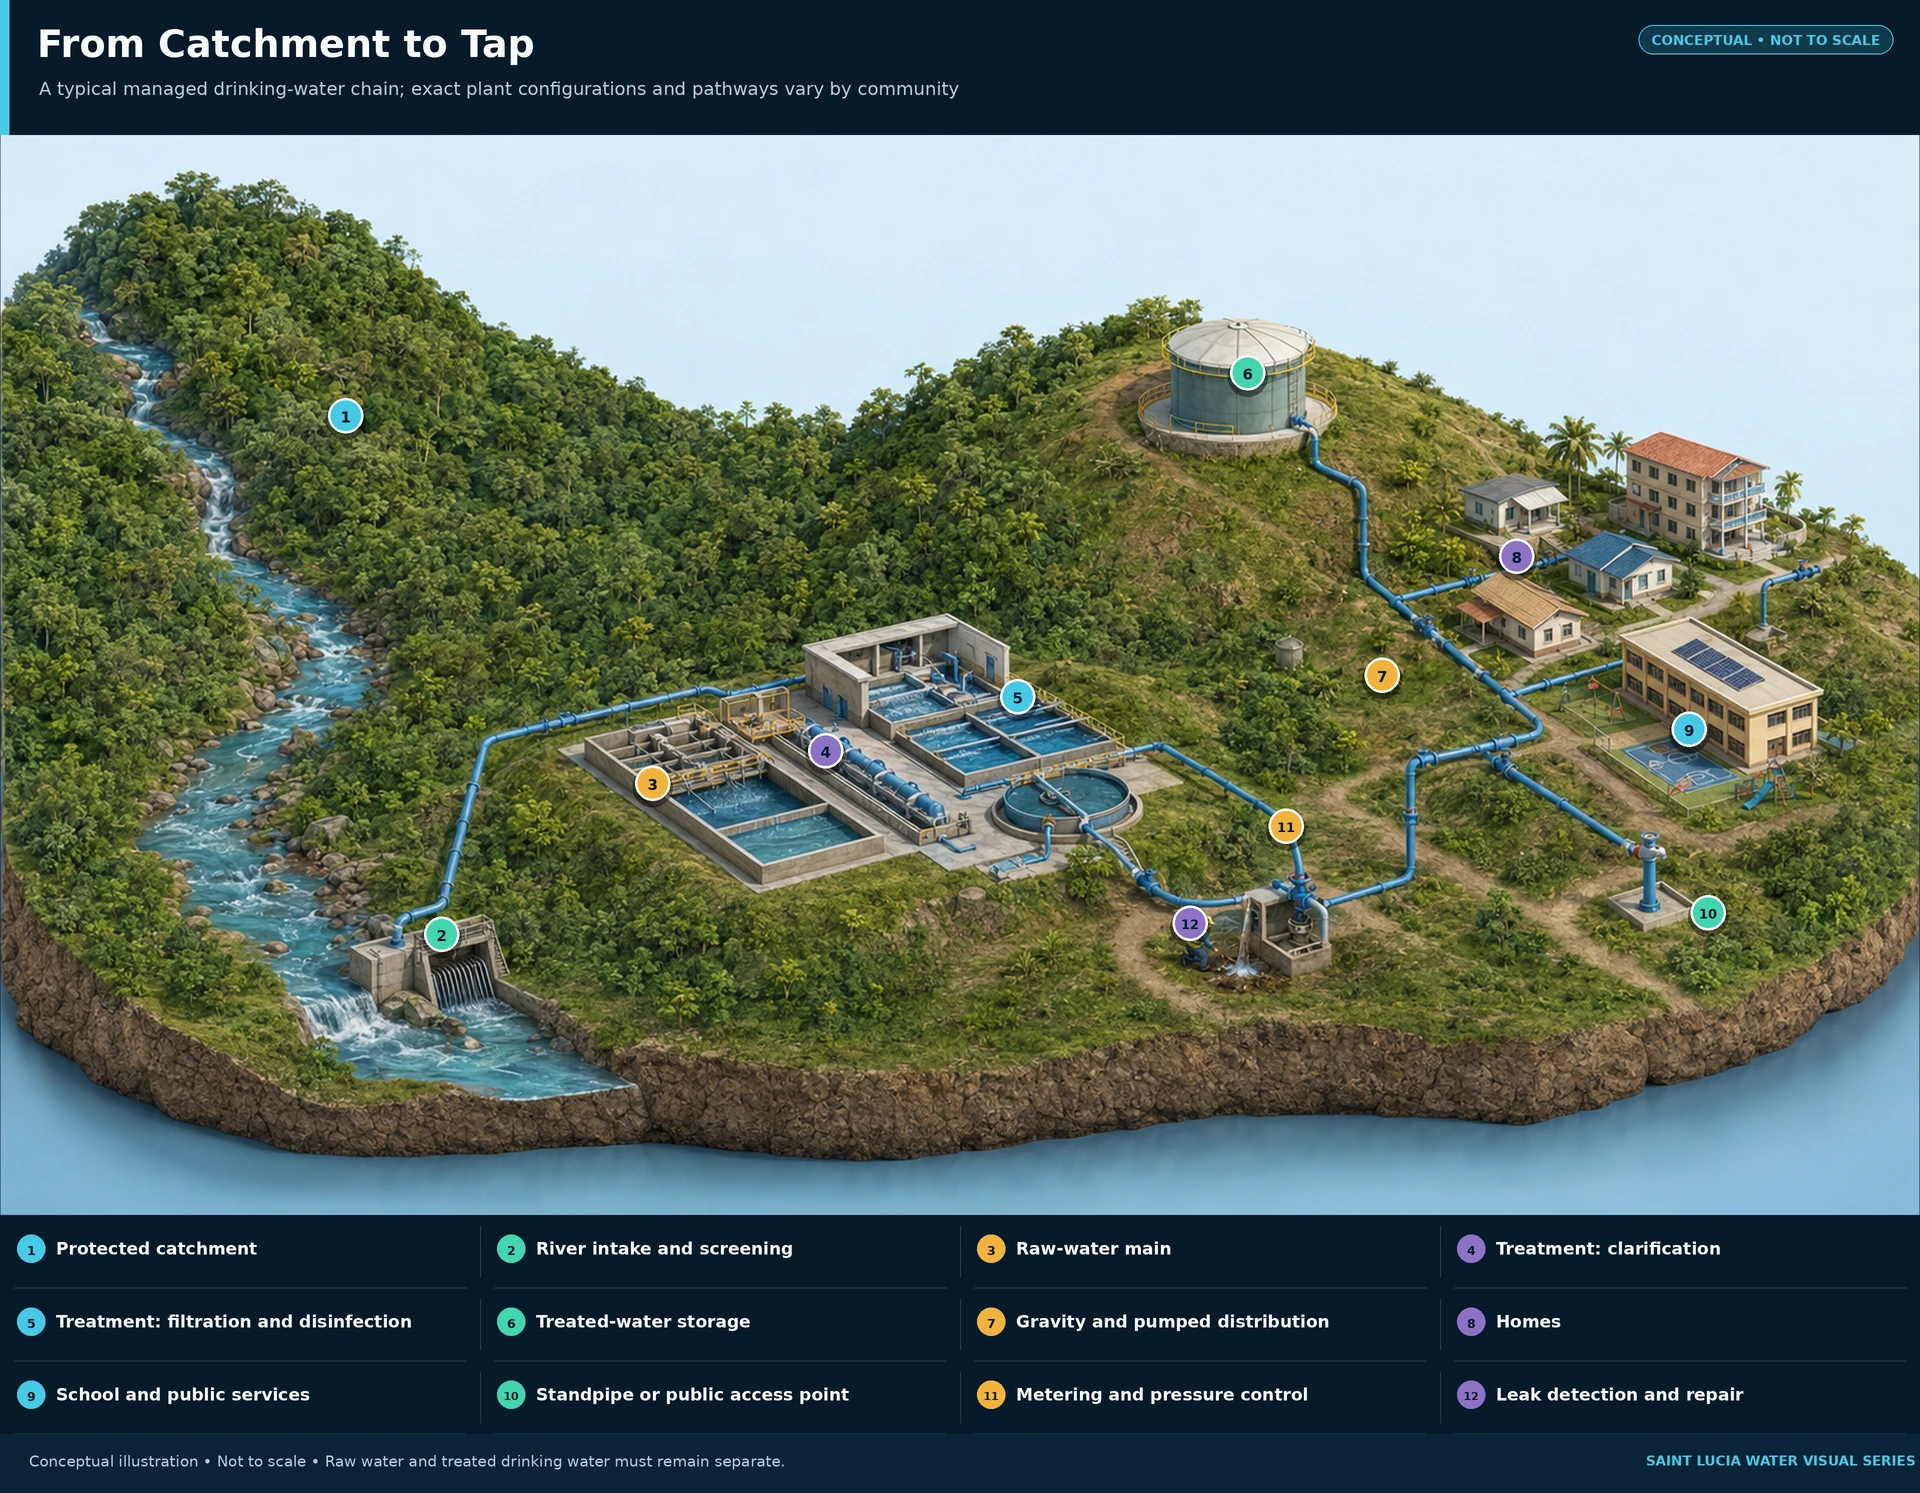
A water cycle describes where water moves in nature. A managed water system explains how raw water becomes a safe public service.
- 01Rain
Water arrives unevenly across seasons, places and storms.
- 02Watershed
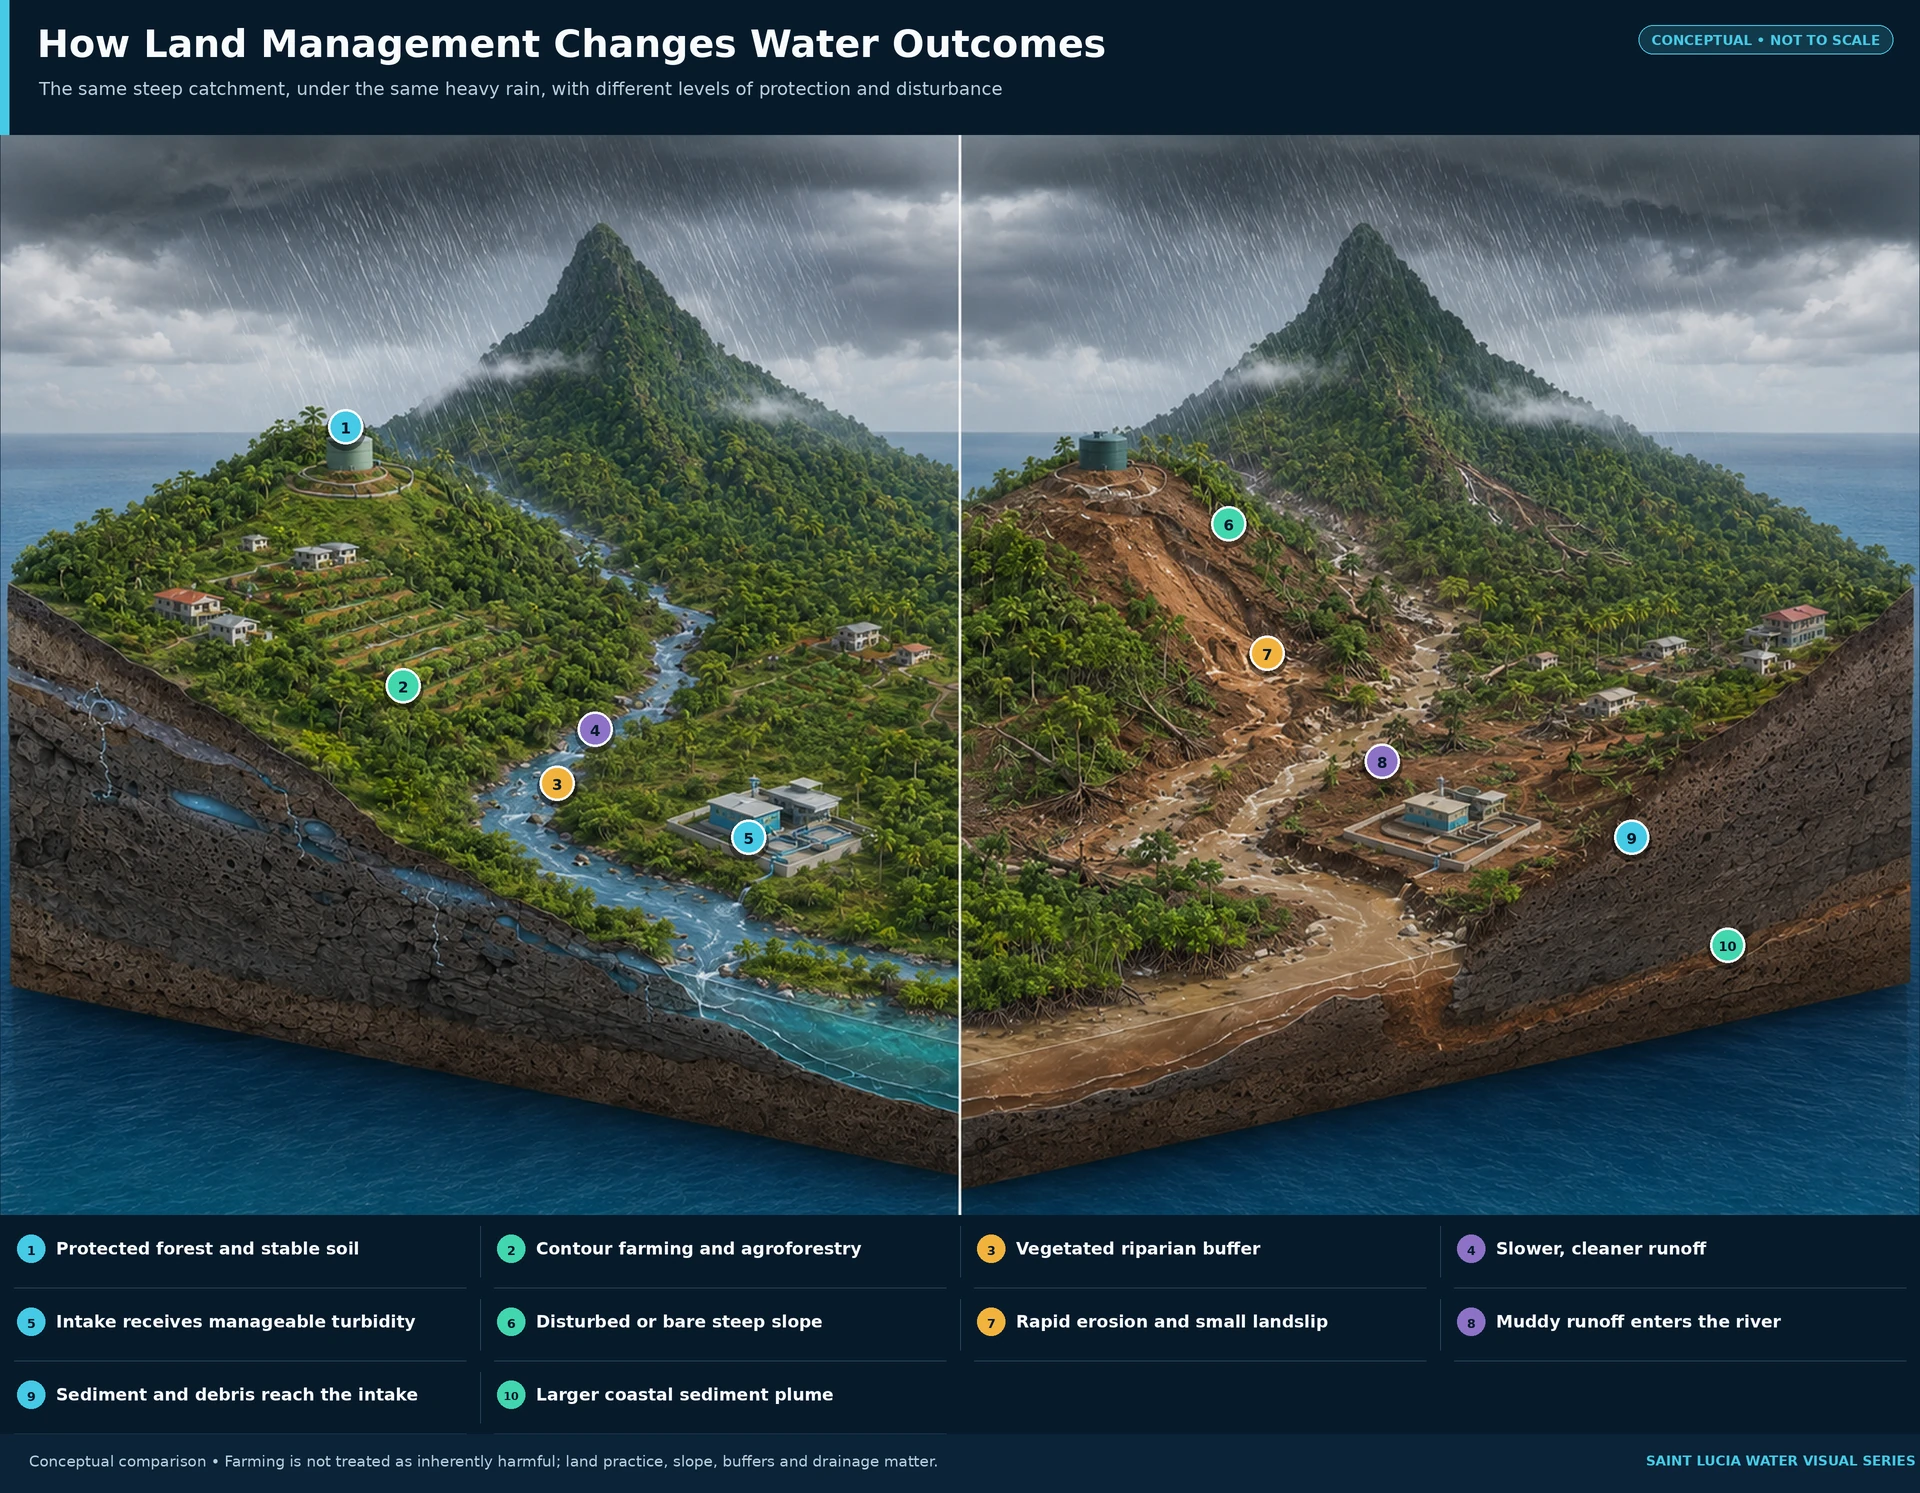
Forest, soil and land use shape how quickly water and sediment reach rivers.
- 03Intake
Rivers, springs and storage provide untreated water to a local supply system.
- 04Treatment
Operators remove particles and harmful organisms, then disinfect and test.
- 05Storage
Reservoirs and tanks create a buffer and help manage pressure.
- 06Network
Mains, pumps, valves and meters move water to each service area.
- 07Use
Homes, clinics, schools, farms and firms turn supply into health and livelihoods.
- 08Return
Wastewater and runoff must be managed before water returns to rivers and sea.
02 Follow the water
Eight links turn rainfall into a managed public service.
Select a link to see what it does, how it can fail and what makes it stronger.
Stage 01 of 08 · Rain
Rain reaches steep volcanic terrain
- What happens
- Moist air rises over Saint Lucia's ridges. Rainfall varies by place, season and storm pattern.
- What can go wrong
- A wet year can still contain dry weeks. Intense rain can arrive too quickly to store and can carry soil into rivers.
- Ways to strengthen it SLPA synthesis
- Dense rainfall and stream gauges, seasonal outlooks and published drought triggers give the system time to act.
01 / 08
Background evidence: Water adaptation plan 03 Stress-test the chain
A dry tap can begin far from the tap.
This learning model traces mechanisms. It is not a live forecast or an official outage tool.
Learning scenario
Less source water meets normal or rising demand
Low river base flow and falling storage can reduce plant output before a household sees the first dry tap.
Links illustrated below are examples, not an exhaustive ranking of impacts.
- 01Rainfall deficit
- 02Lower river flow and storage
- 03Reduced production or pressure
- 04Rotations and costly coping
Watch early
Rainfall, river flow, reservoir and tank levels, demand by supply zone, tanker use and days of priority-site buffer.
Act before failure spreads
Use pre-agreed drought stages, repair high-loss zones first, protect essential sites and activate graduated conservation rules for large users.
04 Saint Lucia’s system now
The core challenge is conversion: turn rain and investment into reliable service.
Published evidence is strong enough to identify the operating problem, but not yet complete enough to score every supply zone.
NURC records this historical 2020–23 range. Non-revenue water includes real leakage and apparent losses such as meter, billing and unauthorized-use errors. It is not a current zone map.
SourceThe June 2026 final determination requires reporting on production, treatment, water quality, service, interruptions, maintenance, customers and NRW. The next step is a standardized public service account.
SourceA 2025 source reported roughly 7% of the population connected to public sewerage. Connection is not the same as safe treatment, and most households rely on onsite systems.
SourceWhat the record supports
- High access and high annual rainfall do not guarantee continuous service.
- Low flow, sediment and turbidity can all reduce treatable supply.
- Historical water loss is high enough to make network operations a first-order supply policy.
- Groundwater is a local option with major mapping and yield gaps, not a proven island-wide solution.
What should be measured next
- Continuity, pressure and interruption connection-hours by zone.
- Physical loss separately from meter, billing and unauthorized-use loss.
- Current reservoir sediment, usable storage and intake shutdown hours.
- Critical asset condition, planned maintenance, energy intensity and repair time.
Infrastructure & operations
Every connection is part of the service.
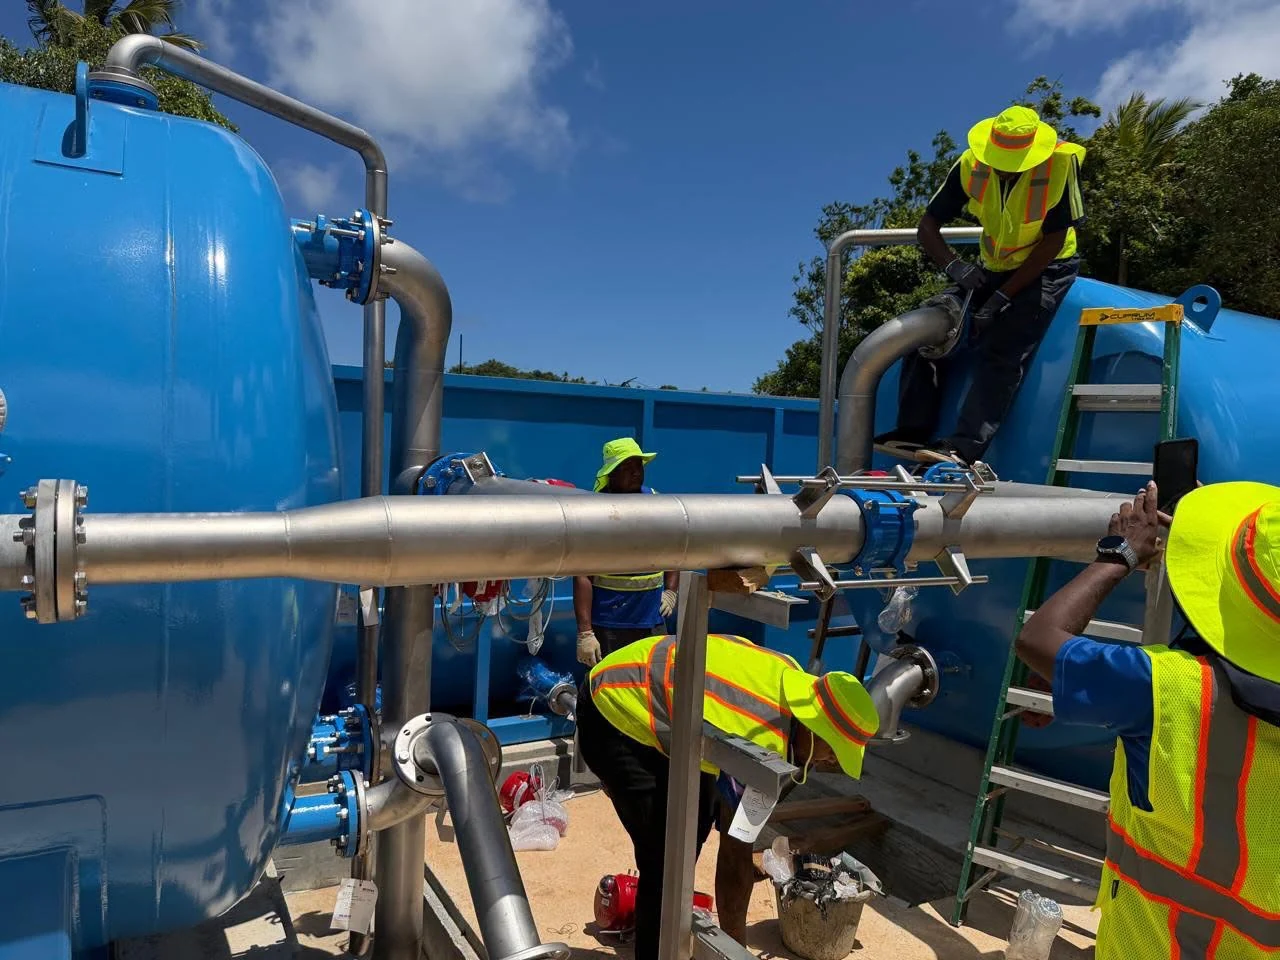
Mains, pumps, valves and meters move water to each service area. Reliable supply also depends on the people, maintenance and spares that keep the system working.
- Know the assets
- Track condition and critical equipment.
- Plan the upkeep
- Fund maintenance, skills and spare parts.
- Measure the service
- Report interruptions, pressure and repair time.
Who does what
Reliability has distinct owners, but one shared result.
WASCO
Abstract, treat, store and distribute drinking water; manage utility assets, customers and parts of the wastewater system.
Statutory and operating roleWRMA
Assess water resources, maintain the national information base, support watershed planning, advise on allocation and monitor changing source conditions.
Water and Sewerage ActNURC
Set and review tariffs and service standards, require information, handle regulatory complaints and use independent enforcement powers.
Final determination, June 2026Government and public agencies
Coordinate public-utility policy, land use, agriculture, forestry, disaster planning, capital finance and environmental safeguards.
Shared institutional chainHealth and SLBS
Set and oversee public-health and drinking-water requirements. SLNS 89:2021 is the national drinking-water standard identified by the Bureau of Standards.
National standard and health lawCustomers and large users
Repair private leaks, use safe storage and comply with staged conservation. Major users should meter key uses, publish intensity and prepare drought plans.
International lesson and SLPA proposalInstitutional descriptions are a public explainer, not a substitute for the Act, licences or current ministerial instruments. Roles were checked through 27 August 2026.
05 Puerto Rico and RIPPLE-4
A warning about compounding stress, not a forecast for Saint Lucia.
Puerto Rico’s 2026 drought directly triggered rationing. The scale of disruption also reflects a system that entered the drought with inherited financial, operational, energy and delivery weaknesses. The institutions and infrastructure are not the same as Saint Lucia’s. The propagation pattern is still instructive.
of active and proposed PRASA construction was postponed or terminated during a liquidity crisis.
EPA OIGof a US$3.663bn FEMA water-sector award had been authorized for expenditure. Awarded money and functioning service are different stages.
GAOresidents in seven municipalities entered alternating 48-hour service as the Carraízo reservoir fell critically low.
AP1Fiscal stress
→Liquidity and debt constrain renewal.
2Deferred capability
→Projects pause; assets and skills age.
3Coupled failure
→Storm, power, pipe and loss problems reinforce one another.
4Inherited burden
Outages, private coping costs, distrust and harder recovery carry forward.
SLPA analysis Not every Puerto Rican outage is caused by fiscal crisis, and the current rationing trigger is a real drought. RIPPLE-4 describes how reduced resilience margin can make separate shocks more damaging and recovery more difficult.
Five lessons Saint Lucia can apply now
- 01
Maintenance cannot be the residual. Ring-fence preventive work, critical spares, trained operators and renewal before assets fail.
- 02
An award is not a water service. Track land, design, procurement, construction, commissioning, operating ownership and 12-month benefit evidence separately.
- 03
Water and electricity are one critical system. Test backup power, fuel, communications and restart procedures at every essential node.
- 04
Measure the loss before claiming the saving. Separate physical leakage from meter and commercial loss, then publish results in volume and percentage.
- 05
Do not privatize resilience. Household tanks help, but reliable public networks and protected critical facilities remain the service standard.
Puerto Rico is also investing: its 2025 fiscal plan describes more than US$7 billion in grants and low-interest finance across roughly 500 water projects. The lesson is not that nothing is being done. It is that finance must become completed, operated and maintained service. Source
06 What has worked elsewhere
Borrow mechanisms, not monuments.
The useful question is not “Which country should Saint Lucia copy?” It is “Which operating practice produced a result, and what must change for Saint Lucia?”
Transfer ruleMeasure and save first. Diversify second. Finance against verified service.
New sources can help, but adding expensive water to a poorly measured, high-loss network can enlarge the same failure.
The BahamasLeak reduction became a source of supply.Open the transfer test
- Documented result
- A New Providence programme reported 68% fewer leaks, better service for more than 38,000 homes and about US$68.7 million in estimated savings by 2018.
- What produced it
- District measurement, pressure control, active leak detection, targeted repair and a long performance arrangement with skills transfer.
- Possible Saint Lucia use
- Start in a few measured high-loss Saint Lucian zones. Pay for sustained water saved and service improved, not pipe length alone.
- Do not over-copy
- Desalinated water makes each saved litre especially valuable in New Providence. Saint Lucia must recalculate the economics locally.
SeychellesA hilly island utility reduced loss zone by zone.Open the transfer test
- Documented result
- Non-revenue water that once exceeded 48% was reported at 29% on Mahé and 22% on Praslin by 2022.
- What produced it
- Leak response, pressure management, better meters, action on unauthorized use and progressive network renewal.
- Possible Saint Lucia use
- Report loss and continuity by Saint Lucian supply zone instead of relying on one national percentage.
- Do not over-copy
- Its network and population are smaller. Results still depend on credible meter and production data.
MaltaMeasurement, low leakage and reuse work as one portfolio.Open the transfer test
- Documented result
- Physical leakage was reported at 9.5% of production in 2023, down from 13% in 2013. Reclaimed New Water supplied 1.5–1.6 million m³ annually in 2023–24.
- What produced it
- Infrastructure Leakage Index tracking, smart meters, GIS, accredited testing and a controlled non-potable reuse network.
- Possible Saint Lucia use
- Borrow the loss metrics, independent testing and reuse discipline before copying any plant mix.
- Do not over-copy
- Malta is denser, wealthier, drier and heavily supported by EU finance. Its desalination mix is not a template for Saint Lucia.
BermudaRoof catchment is treated as building infrastructure.Open the transfer test
- Documented result
- The building framework requires at least 80% of suitable roof area to be guttered and sets minimum storage tied to catchment area.
- What produced it
- A clear construction rule makes distributed capture and storage normal rather than optional.
- Possible Saint Lucia use
- Set safe standards for new public buildings, hotels and larger developments, with targeted help for vulnerable households and critical sites.
- Do not over-copy
- Stored roof water can be contaminated. Screens, first flush, sealed tanks, separate plumbing, inspection and treatment rules are essential.
SingaporeLarge users must understand their own water balance.Open the transfer test
- Documented result
- Large sites must submeter major uses, prepare annual efficiency plans and appoint a water-efficiency manager. A grant fund supports verified saving and recycling projects.
- What produced it
- Mandatory measurement is paired with technical support and finance, then reuse is matched to suitable end users.
- Possible Saint Lucia use
- Apply a locally scaled rule first to hotels, hospitals, beverage plants and large public campuses.
- Do not over-copy
- Singapore’s finance, sewer coverage and technical depth are exceptional. Near-term potable reuse would not be a like-for-like transfer.
07 From explanation to policy
Strengthen the whole chain, in a disciplined order.
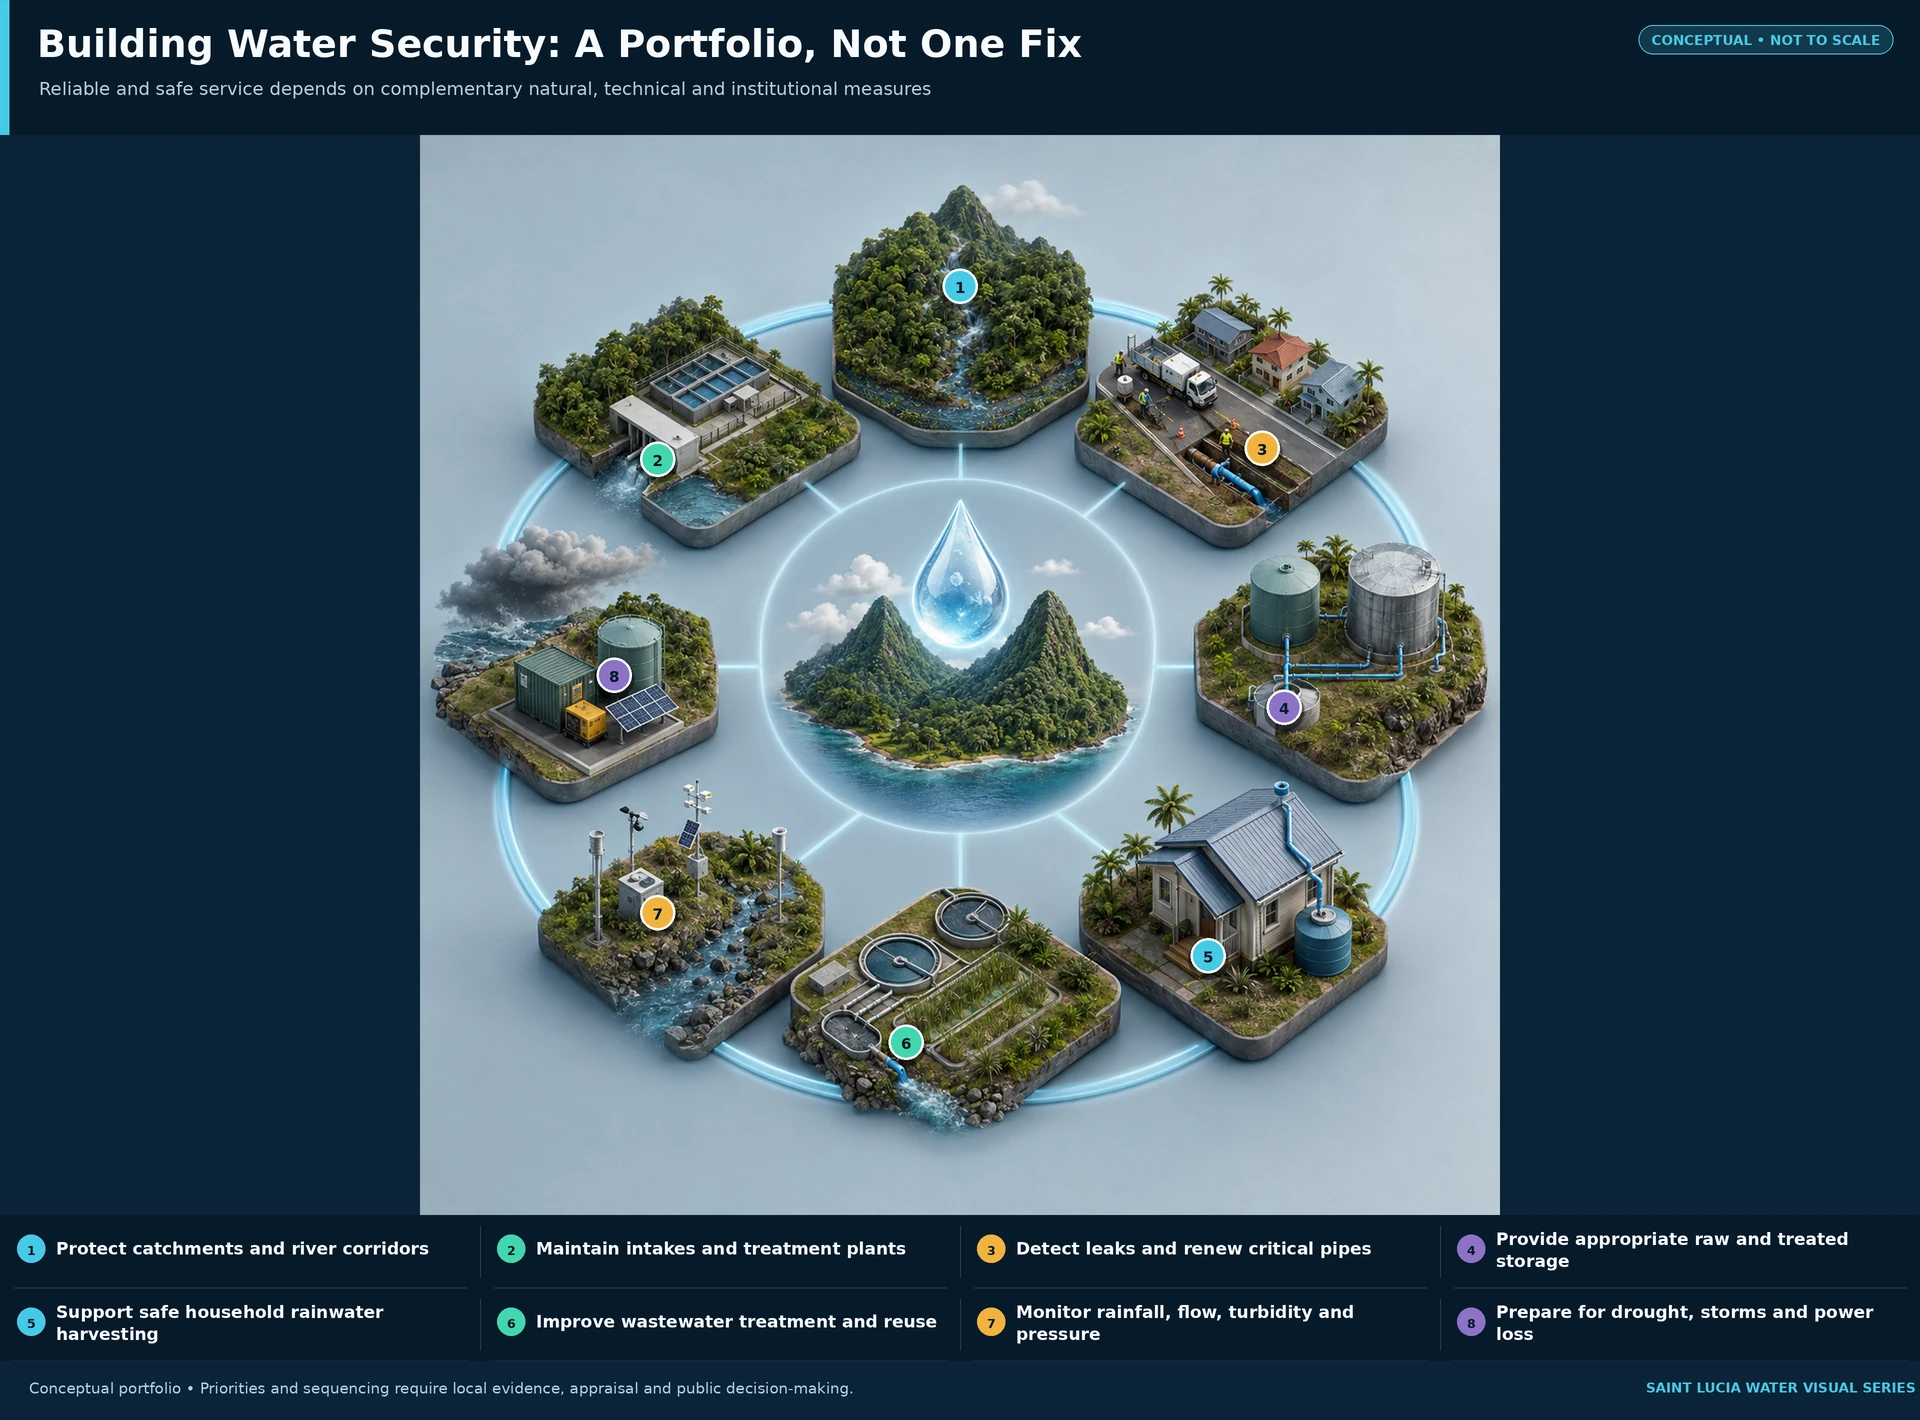
The explainer answers how the system works and why it struggles. The national plan sets out what to do, who should lead, how to sequence action and when to stop or adapt.
Read the strengthened national planPublish the service account
One data dictionary and regular zone accounts for input, billed use, interruptions, pressure, quality, complaints and loss components.
Make water safety operational
Catchment-to-customer Water Safety Plans, starting with treatment systems, hospitals, shelters, clinics and schools.
Prove loss reduction in measured zones
Combine meters, pressure management, leak detection, meter correction, connection regularisation, fast repair and valve maintenance.
Fund maintenance, people and spares
One asset register, criticality map, preventive schedule, standard parts catalogue, trained operators and funded lifecycle plans.
Act before dry or muddy extremes
Publish source-specific stages for drought, turbidity, storage and treatment pressure, with clear restrictions and lifting rules.
Build safe distributed resilience
Site-specific storage at critical facilities, safe household standards and large-user metering, buffers and conservation plans.
Protect catchments and reduce sediment
Rank source areas by people served and operational risk; fund measurable changes in turbidity, sediment and intake interruption.
Keep future sources as tested options
Assess groundwater, reuse, storage and desalination only after water balances, loss control, energy, cost and environmental gates are passed.
Decision ruleCommit now to measurement, repair capability, water safety, maintenance, buffers and watershed protection. Keep major new source choices modular until residual need, operating capacity, energy, cost and environmental limits are verified.
08 What happens next
Public systems carry the duty. Households can add a safe buffer.
Check your understanding
Can you trace the system?
01Why can heavy rain cause a water interruption?
Intense rain can erode steep slopes and carry mud and debris into rivers. High turbidity can block an intake or exceed safe treatment capacity, so operators may need to reduce production until raw-water quality improves.
02Does Saint Lucia have a shortage of rainfall or a shortage of infrastructure?
Both hydrology and the managed system matter. Dry periods reduce source flow, while loss, limited storage, treatment constraints, power, maintenance and network faults determine how much safe water reaches each customer.
03Is groundwater the answer?
It is an option to investigate, not a proven national answer. Groundwater in weathered and fractured volcanic rock can be local and irregular. Saint Lucia still needs stronger mapping, monitoring and sustainable-yield evidence.
Evidence, method and limits
A living explainer, not an official system map.
SLPA reviewed laws, regulatory decisions, utility and government material, development-finance documents, public statistics, international technical sources and current reporting. We separate dated evidence, analysis, international lessons and proposals. Missing public data are shown as gaps rather than filled with false precision.
A source directly supports the statement for its stated date and unit.
SLPA connects sourced facts or applies RIPPLE-4; it is not an official causal finding.
A documented mechanism is screened for scale, hydrology, finance and institutional fit.
A recommendation for public testing, not announced Government policy.
Primary and technical sources22 source notes
- slu-jicaData Collection Survey on Caribbean Regional Water Supply ImprovementOpen source
Japan International Cooperation Agency, June 2024
- slu-nurcFinal Determination NoticeOpen source
National Utilities Regulatory Commission, June 2026
- slu-cdbClimate-resilient water and wastewater masterplan technical assistanceOpen source
Caribbean Development Bank, 2024
- slu-sasapSaint Lucia’s Sectoral Adaptation Strategy and Action Plan for the Water SectorOpen source
Government of Saint Lucia, 2018
- slu-actWater and Sewerage Act, Cap. 9.03Open source
Government of Saint Lucia
- slu-wrmaWater Resource Management AgencyOpen source
Government of Saint Lucia
- slu-dry-2026WASCO statement on Delcer network supply conditionsOpen source
Government of Saint Lucia / WASCO, 18 August 2026
- slu-pipeline-2026Northern pipeline upgrade works commenceOpen source
Government of Saint Lucia / WASCO, 25 August 2026
- slu-wastewaterImproving wastewater management in Saint LuciaOpen source
Global Green Growth Institute, 11 December 2025
- slu-standardUnderstanding the standards behind safe drinking waterOpen source
Saint Lucia Bureau of Standards, 17 June 2026
- pr-fiscalManagement of Puerto Rico’s revolving funds during financial crisisOpen source
US EPA Office of Inspector General, 2017
- pr-mariaDrinking-water system recovery after hurricanes Irma and MaríaOpen source
US EPA Office of Inspector General, 2020
- pr-gaoPuerto Rico recovery: water-sector award and expenditure statusOpen source
US Government Accountability Office, 2024
- pr-droughtPuerto Rico to start water rationing as drought worsensOpen source
Associated Press, 5 August 2026
- pr-currentPuerto Rico extends emergency measures as drought deepensOpen source
Associated Press, 26 August 2026
- pr-recoveryImproving Puerto Rico’s clean water supplyOpen source
Financial Oversight and Management Board, 2025
- practice-bahamasInnovation in the Caribbean: New Providence water-loss programmeOpen source
Inter-American Development Bank
- practice-seychellesSeychelles country diagnostic noteOpen source
African Development Bank, 2025
- practice-maltaNational Investment Plan and New Water programmeOpen source
Water Services Corporation, Malta
- practice-bermudaBermuda rainwater catchment and storage requirementsOpen source
Government of Bermuda
- practice-singaporeMandatory water-efficiency requirementsOpen source
PUB, Singapore
- who-water-safetyWater Safety Plan manualOpen source
World Health Organization
Important limitsRead before reusing figures
- The 47–58% NRW range is historical and combines physical and apparent losses. It is not a current estimate for every zone.
- Older production, demand-deficit and reservoir-sediment estimates remain dated planning evidence until refreshed.
- The 98% coverage and 75% rainy-season / 60% dry-season continuity figures are a 2020–23 baseline consolidated in 2024, not current performance.
- Groundwater, reuse and desalination remain options to assess. None is presented here as a proven national solution.
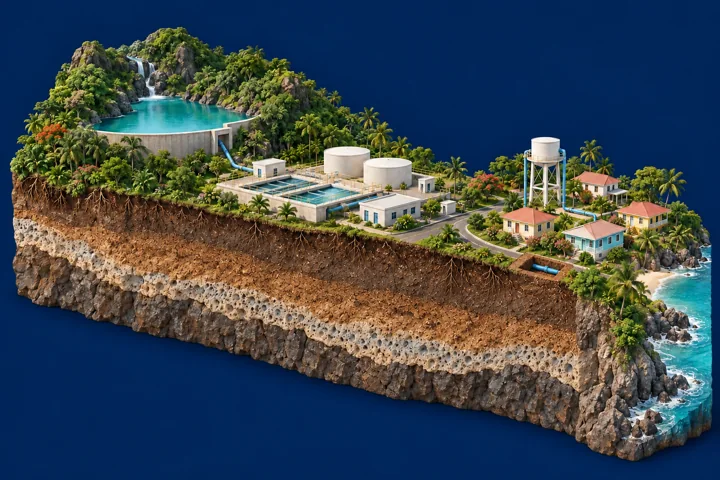
- Generated visuals are conceptual teaching aids. They are not documentary evidence, engineering designs or maps of exact facilities.
- The Puerto Rico section is a comparative systems analysis. It does not claim identical institutions or that fiscal stress caused every outage.
Experimental explainer v0.1 · Research cutoff 27 August 2026 · Substantive corrections are welcome through the SLPA contact route.