Cost of living / Data chart
The higher price level.
Follow Saint Lucia’s consumer price index from December 2019 to June 2026.
December 2019–June 2026 · Published 24 October 2026
High-resolution PNG · A4 PDF · CSV data · Edition 04
Reading the visual
What to look for.
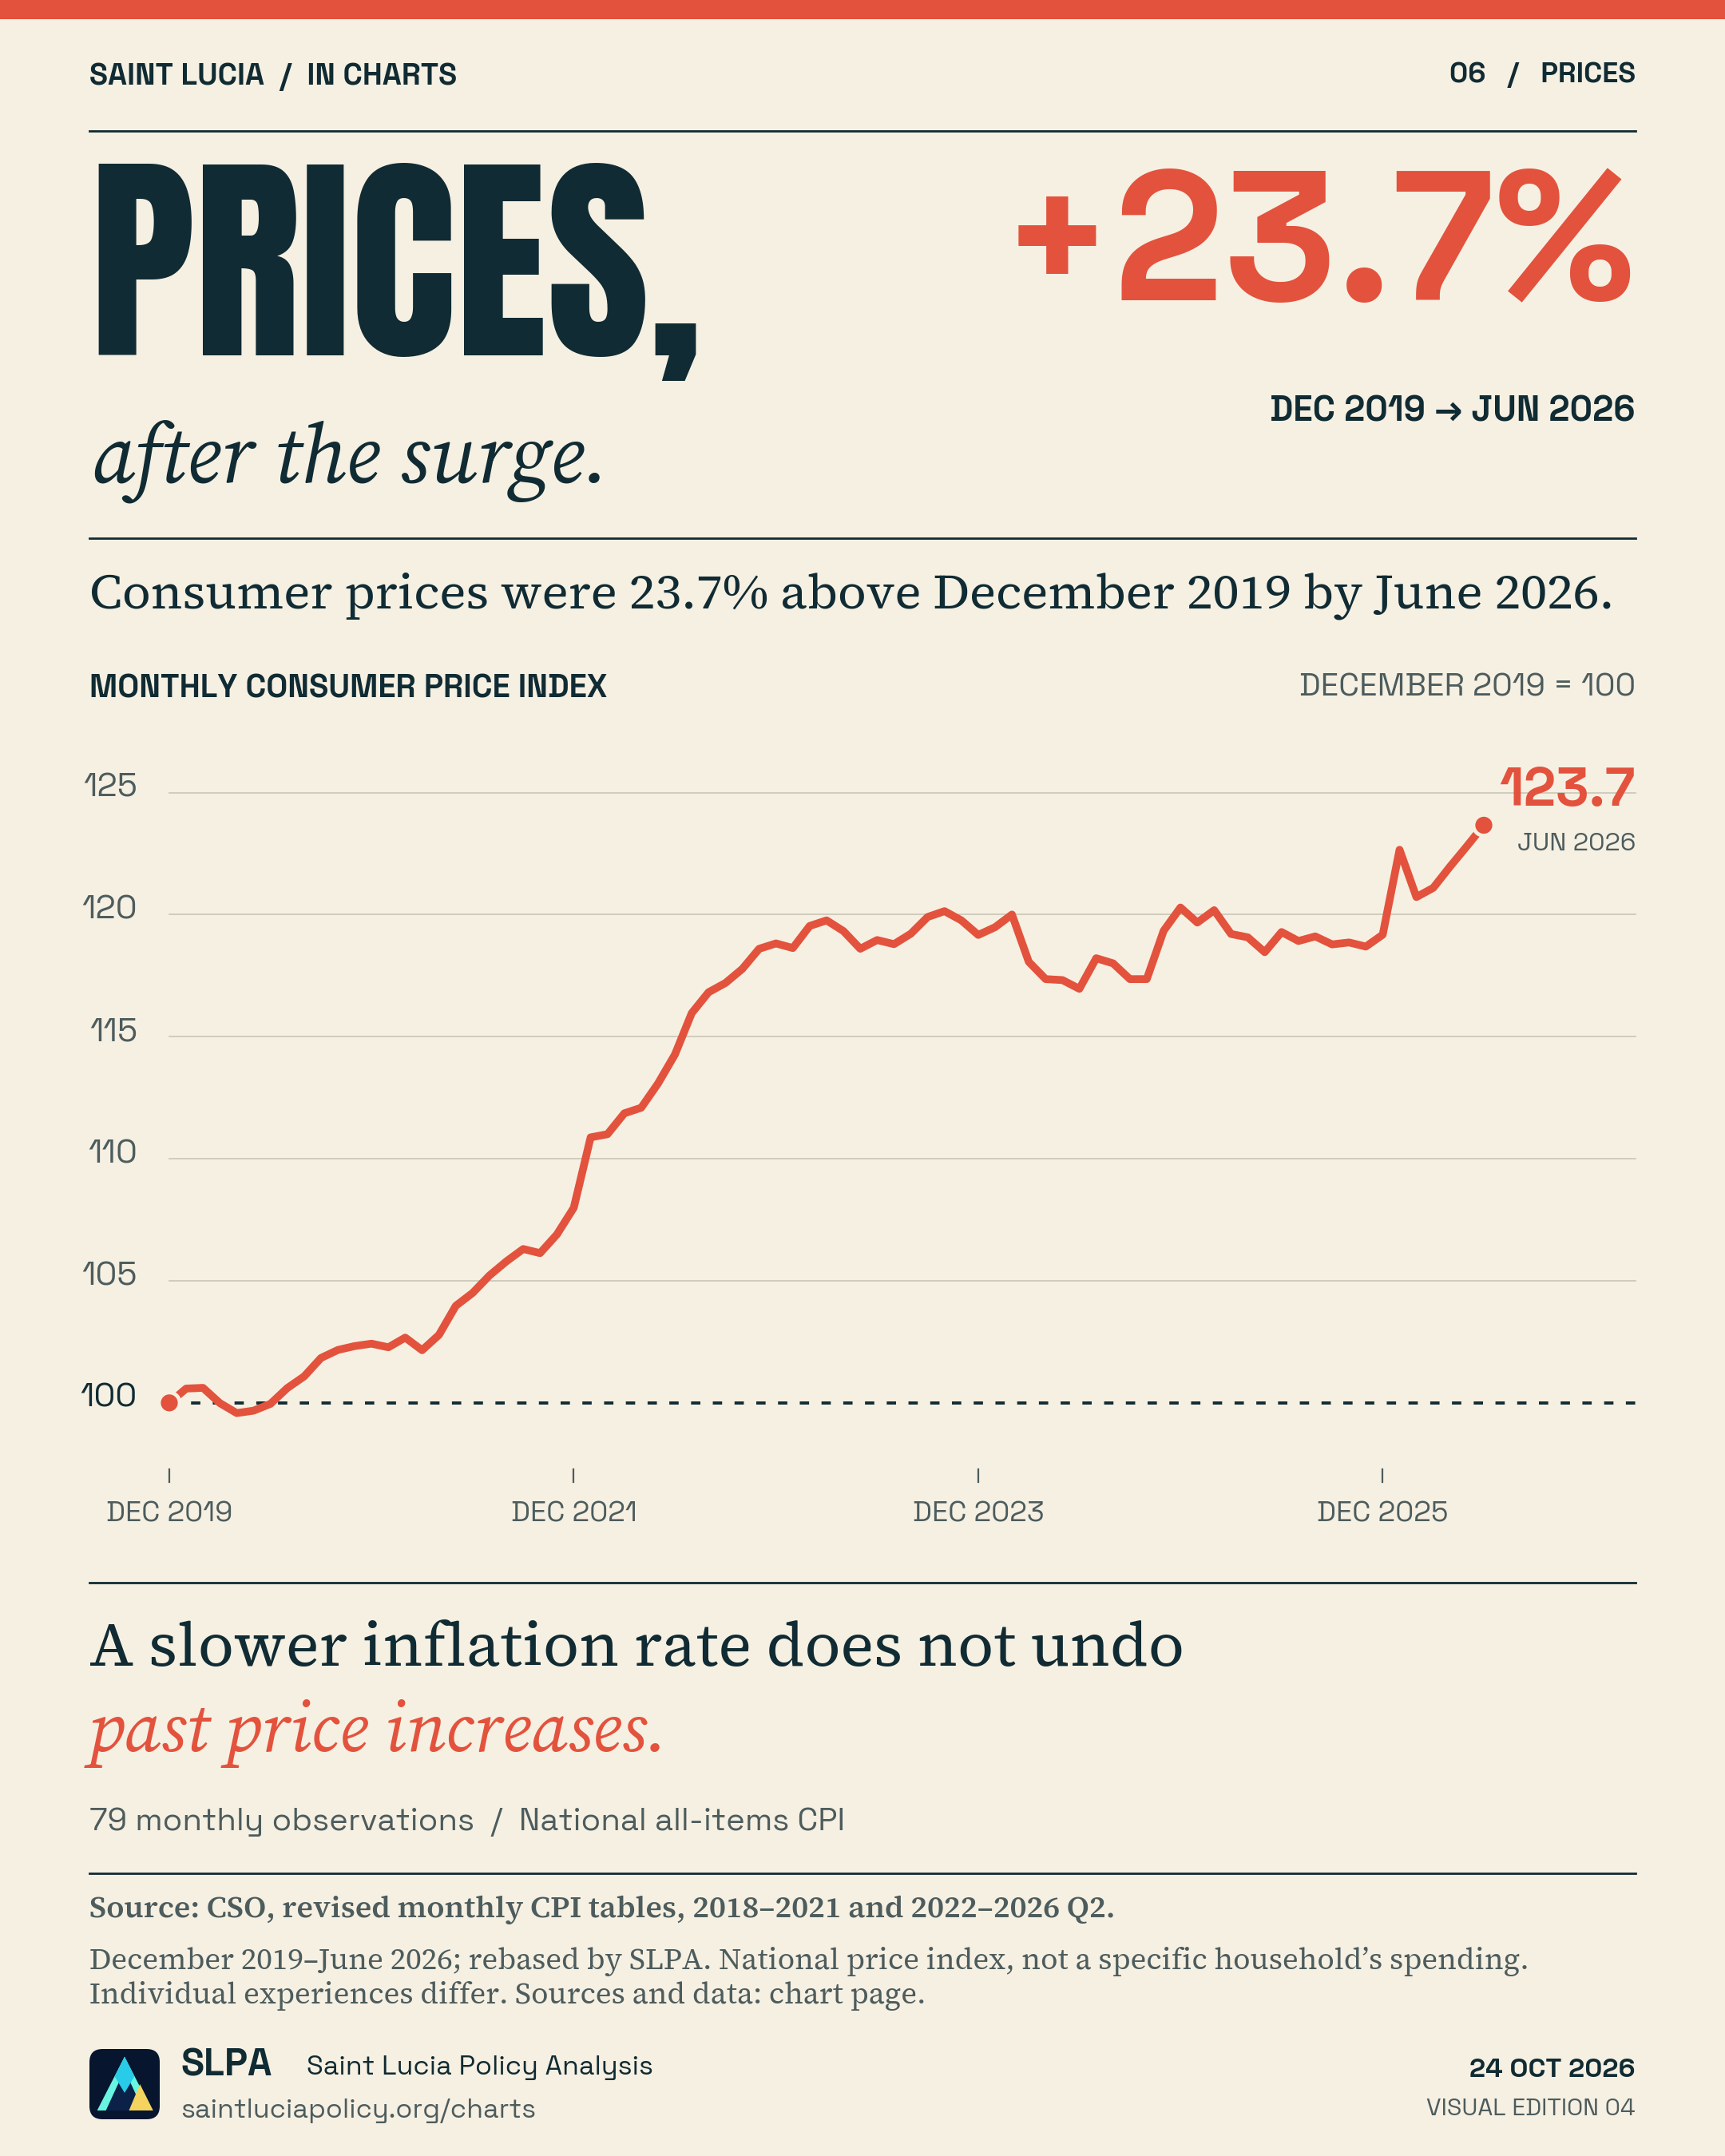
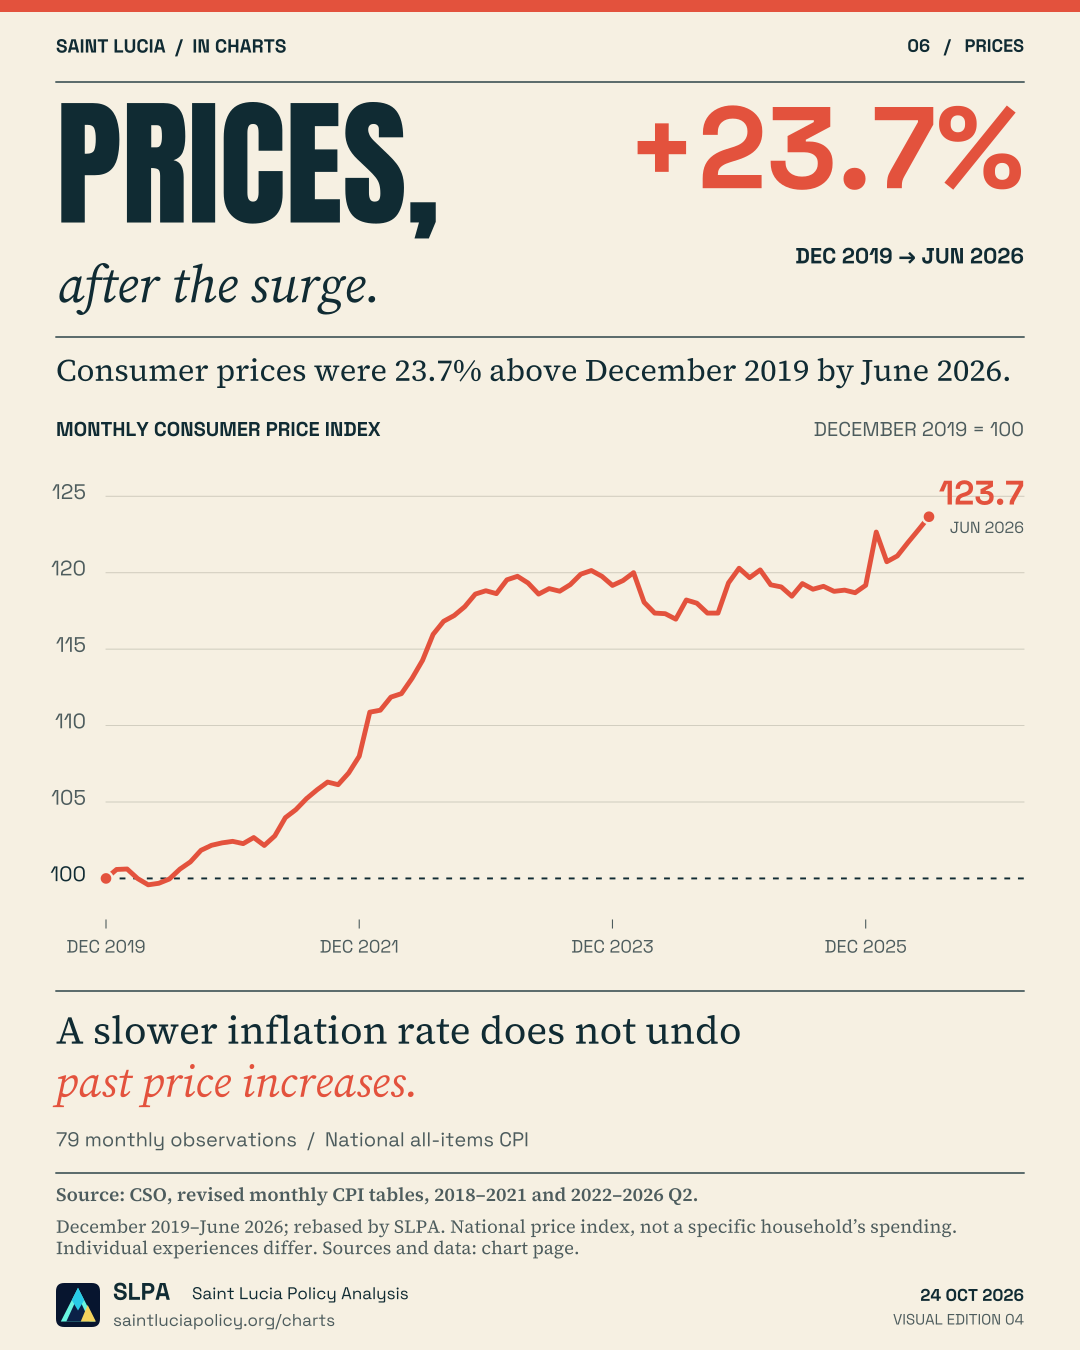
The line follows 79 monthly observations, with December 2019 set to 100. June 2026 reaches 123.7. The increase of 23.7% compares the two price levels; it is not an annual inflation rate.
Revised national all-items CPI. Household experiences differ with spending patterns. This chart does not measure changes in wages or affordability. Use one coherent revised history, rather than mixing older standalone annual releases.
Read the price-level researchFollow the evidence
Sources & method.
Central Statistical Office, revised monthly all-items Consumer Price Index: 2018–2021 and 2022–2026 Q2. The visual uses 79 consecutive monthly observations from December 2019 through June 2026, the latest observation in the checked revised table.
The published index uses January 2018 = 100. SLPA resets December 2019 to 100 so that the accumulated change is easier to read: each month’s published CPI ÷ 100.58 × 100. Cumulative percentage change = this rebased index − 100. Thus 124.38 ÷ 100.58 × 100 = 123.7 in June 2026, or 23.7% above December 2019.
Inspect all 79 monthly values
| Month | Published CPI (January 2018 = 100) | SLPA rebased index (December 2019 = 100) |
|---|---|---|
| 100.58 | 100.00 | |
| 101.17 | 100.59 | |
| 101.20 | 100.62 | |
| 100.57 | 99.99 | |
| 100.16 | 99.58 | |
| 100.26 | 99.68 | |
| 100.54 | 99.96 | |
| 101.19 | 100.61 | |
| 101.67 | 101.08 | |
| 102.43 | 101.84 | |
| 102.76 | 102.17 | |
| 102.92 | 102.33 | |
| 103.02 | 102.43 | |
| 102.87 | 102.28 | |
| 103.27 | 102.67 | |
| 102.75 | 102.16 | |
| 103.38 | 102.78 | |
| 104.58 | 103.98 | |
| 105.11 | 104.50 | |
| 105.83 | 105.22 | |
| 106.41 | 105.80 | |
| 106.92 | 106.30 | |
| 106.75 | 106.13 | |
| 107.52 | 106.90 | |
| 108.62 | 107.99 | |
| 111.52 | 110.88 | |
| 111.65 | 111.01 | |
| 112.51 | 111.86 | |
| 112.74 | 112.09 | |
| 113.74 | 113.08 | |
| 114.93 | 114.27 | |
| 116.64 | 115.97 | |
| 117.50 | 116.82 | |
| 117.88 | 117.20 | |
| 118.46 | 117.78 | |
| 119.29 | 118.60 | |
| 119.51 | 118.82 | |
| 119.32 | 118.63 | |
| 120.23 | 119.54 | |
| 120.46 | 119.77 | |
| 120.02 | 119.33 | |
| 119.29 | 118.60 | |
| 119.65 | 118.96 | |
| 119.48 | 118.79 | |
| 119.91 | 119.22 | |
| 120.60 | 119.90 | |
| 120.84 | 120.14 | |
| 120.46 | 119.77 | |
| 119.86 | 119.17 | |
| 120.18 | 119.49 | |
| 120.70 | 120.00 | |
| 118.75 | 118.07 | |
| 118.04 | 117.36 | |
| 118.00 | 117.32 | |
| 117.64 | 116.96 | |
| 118.90 | 118.21 | |
| 118.69 | 118.01 | |
| 118.04 | 117.36 | |
| 118.04 | 117.36 | |
| 120.03 | 119.34 | |
| 120.99 | 120.29 | |
| 120.37 | 119.68 | |
| 120.88 | 120.18 | |
| 119.90 | 119.21 | |
| 119.76 | 119.07 | |
| 119.15 | 118.46 | |
| 119.98 | 119.29 | |
| 119.61 | 118.92 | |
| 119.80 | 119.11 | |
| 119.47 | 118.78 | |
| 119.55 | 118.86 | |
| 119.38 | 118.69 | |
| 119.87 | 119.18 | |
| 123.37 | 122.66 | |
| 121.42 | 120.72 | |
| 121.80 | 121.10 | |
| 122.68 | 121.97 | |
| 123.52 | 122.81 | |
| 124.38 | 123.66 |
Both source tables belong to the same revised publication series. Calculations use the published CPI values before rounding the result. This measures a national price level, not the cost of a particular household’s shopping basket or a change in income. Monthly prices can fall while remaining above the starting level. The CSV retains the monthly source values and calculated indices.