The visual collection Saint Lucia Policy Analysis
Saint Lucia,in charts. Look closer. See the connections.
Read it. Keep it. Share it.
More ways to look closer. 8 of 8 visuals
Order Newest edition first Series order · 01 onwards
All visuals 8 Cost of living 1 Work 1 Households 1 Tourism 2 Public money 2 Parliament 1
PNG for sharing · PDF for printing · SVG for scaling · CSV where data is available
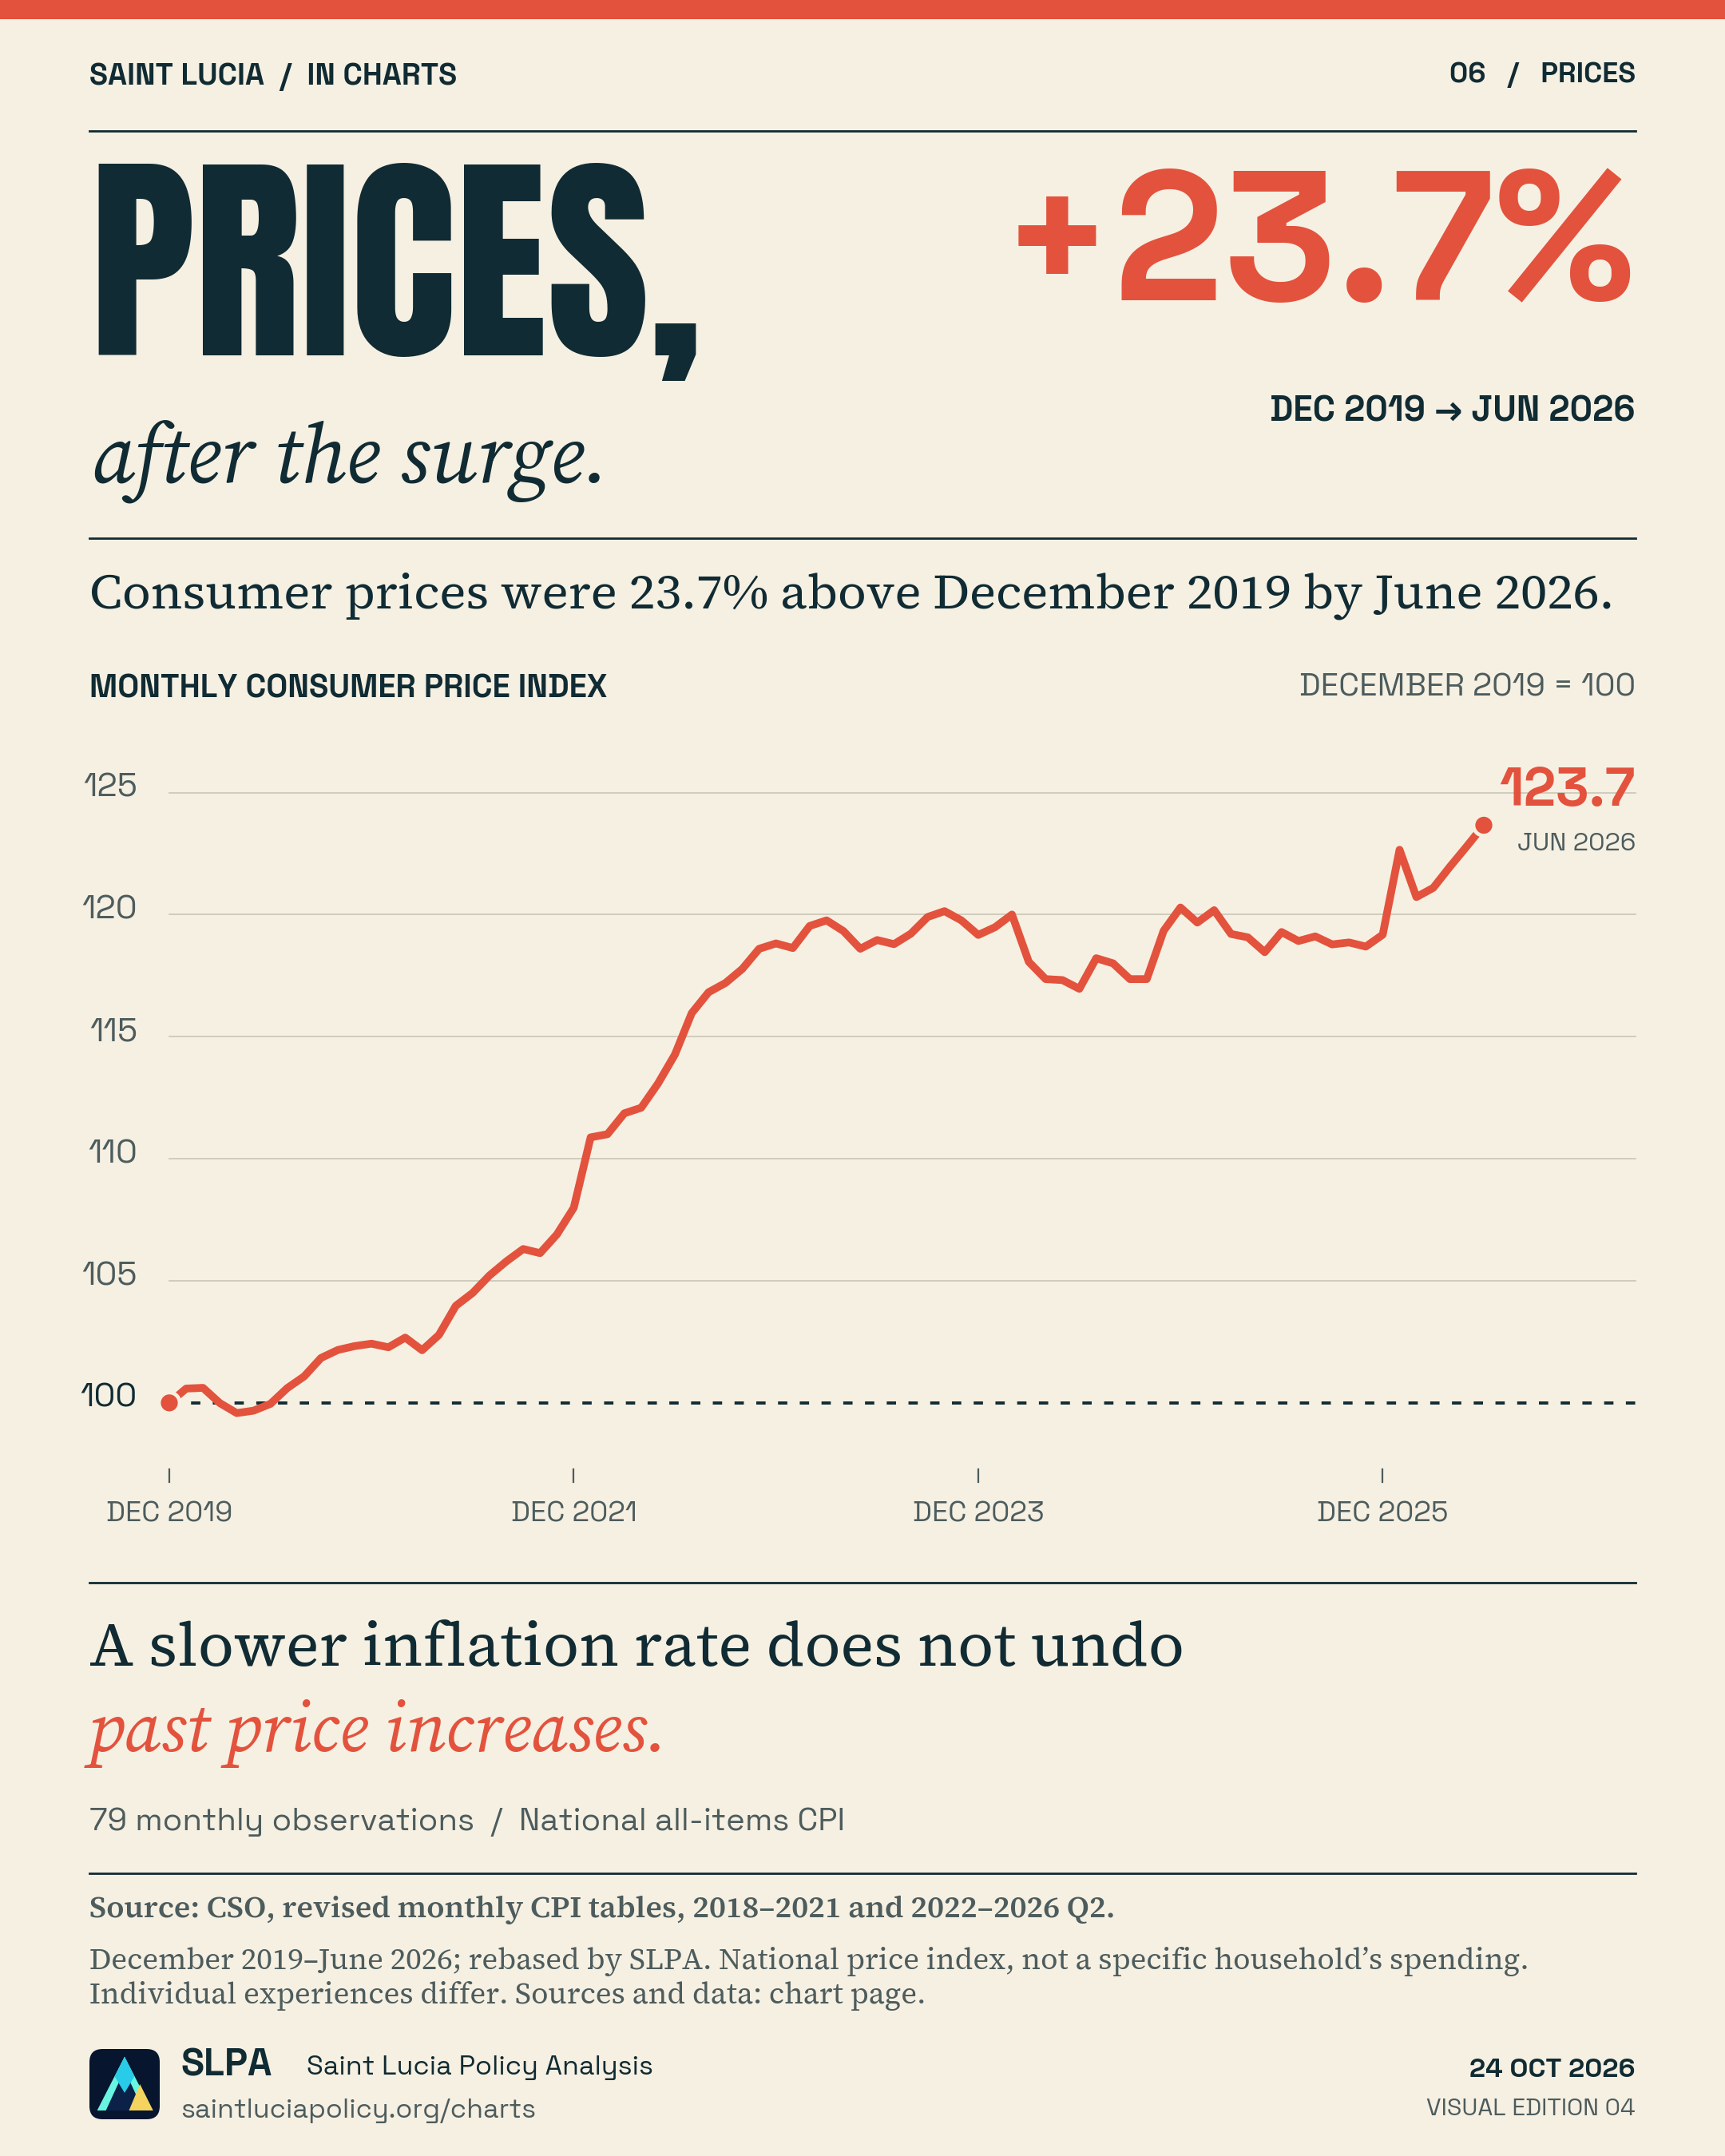
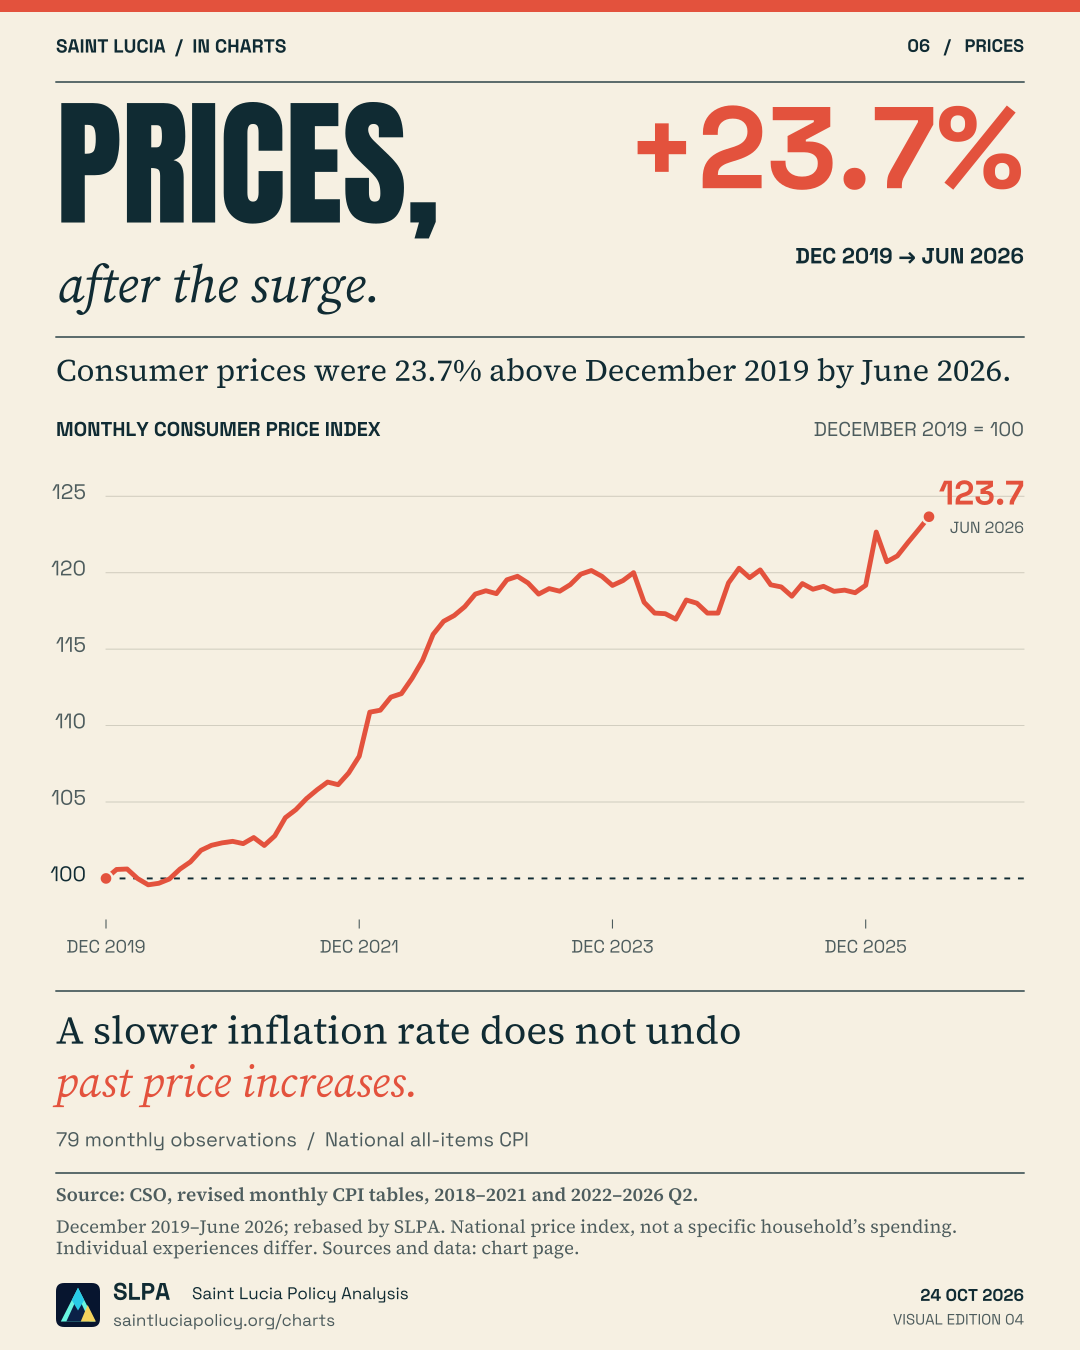
06 Cost of livingData chartNew · Edition 04
View graphic & sources ↗ December 2019–June 2026
Follow Saint Lucia’s consumer price index from December 2019 to June 2026.
The finding By June 2026, the national consumer price index was 23.7% above December 2019. A lower inflation rate does not, by itself, undo earlier price increases.
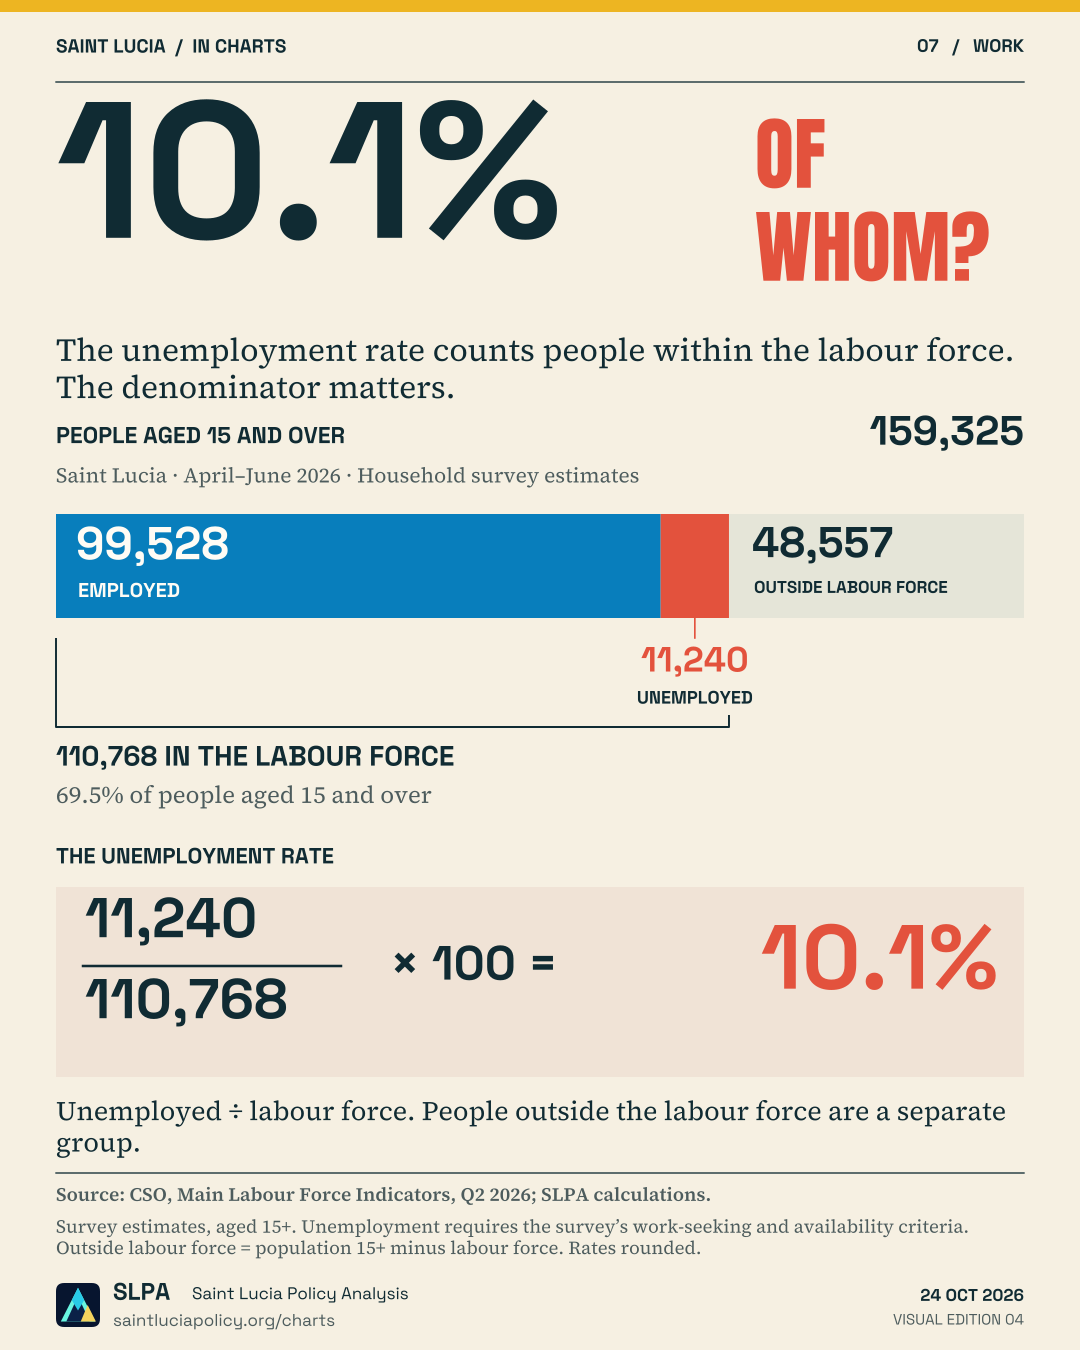
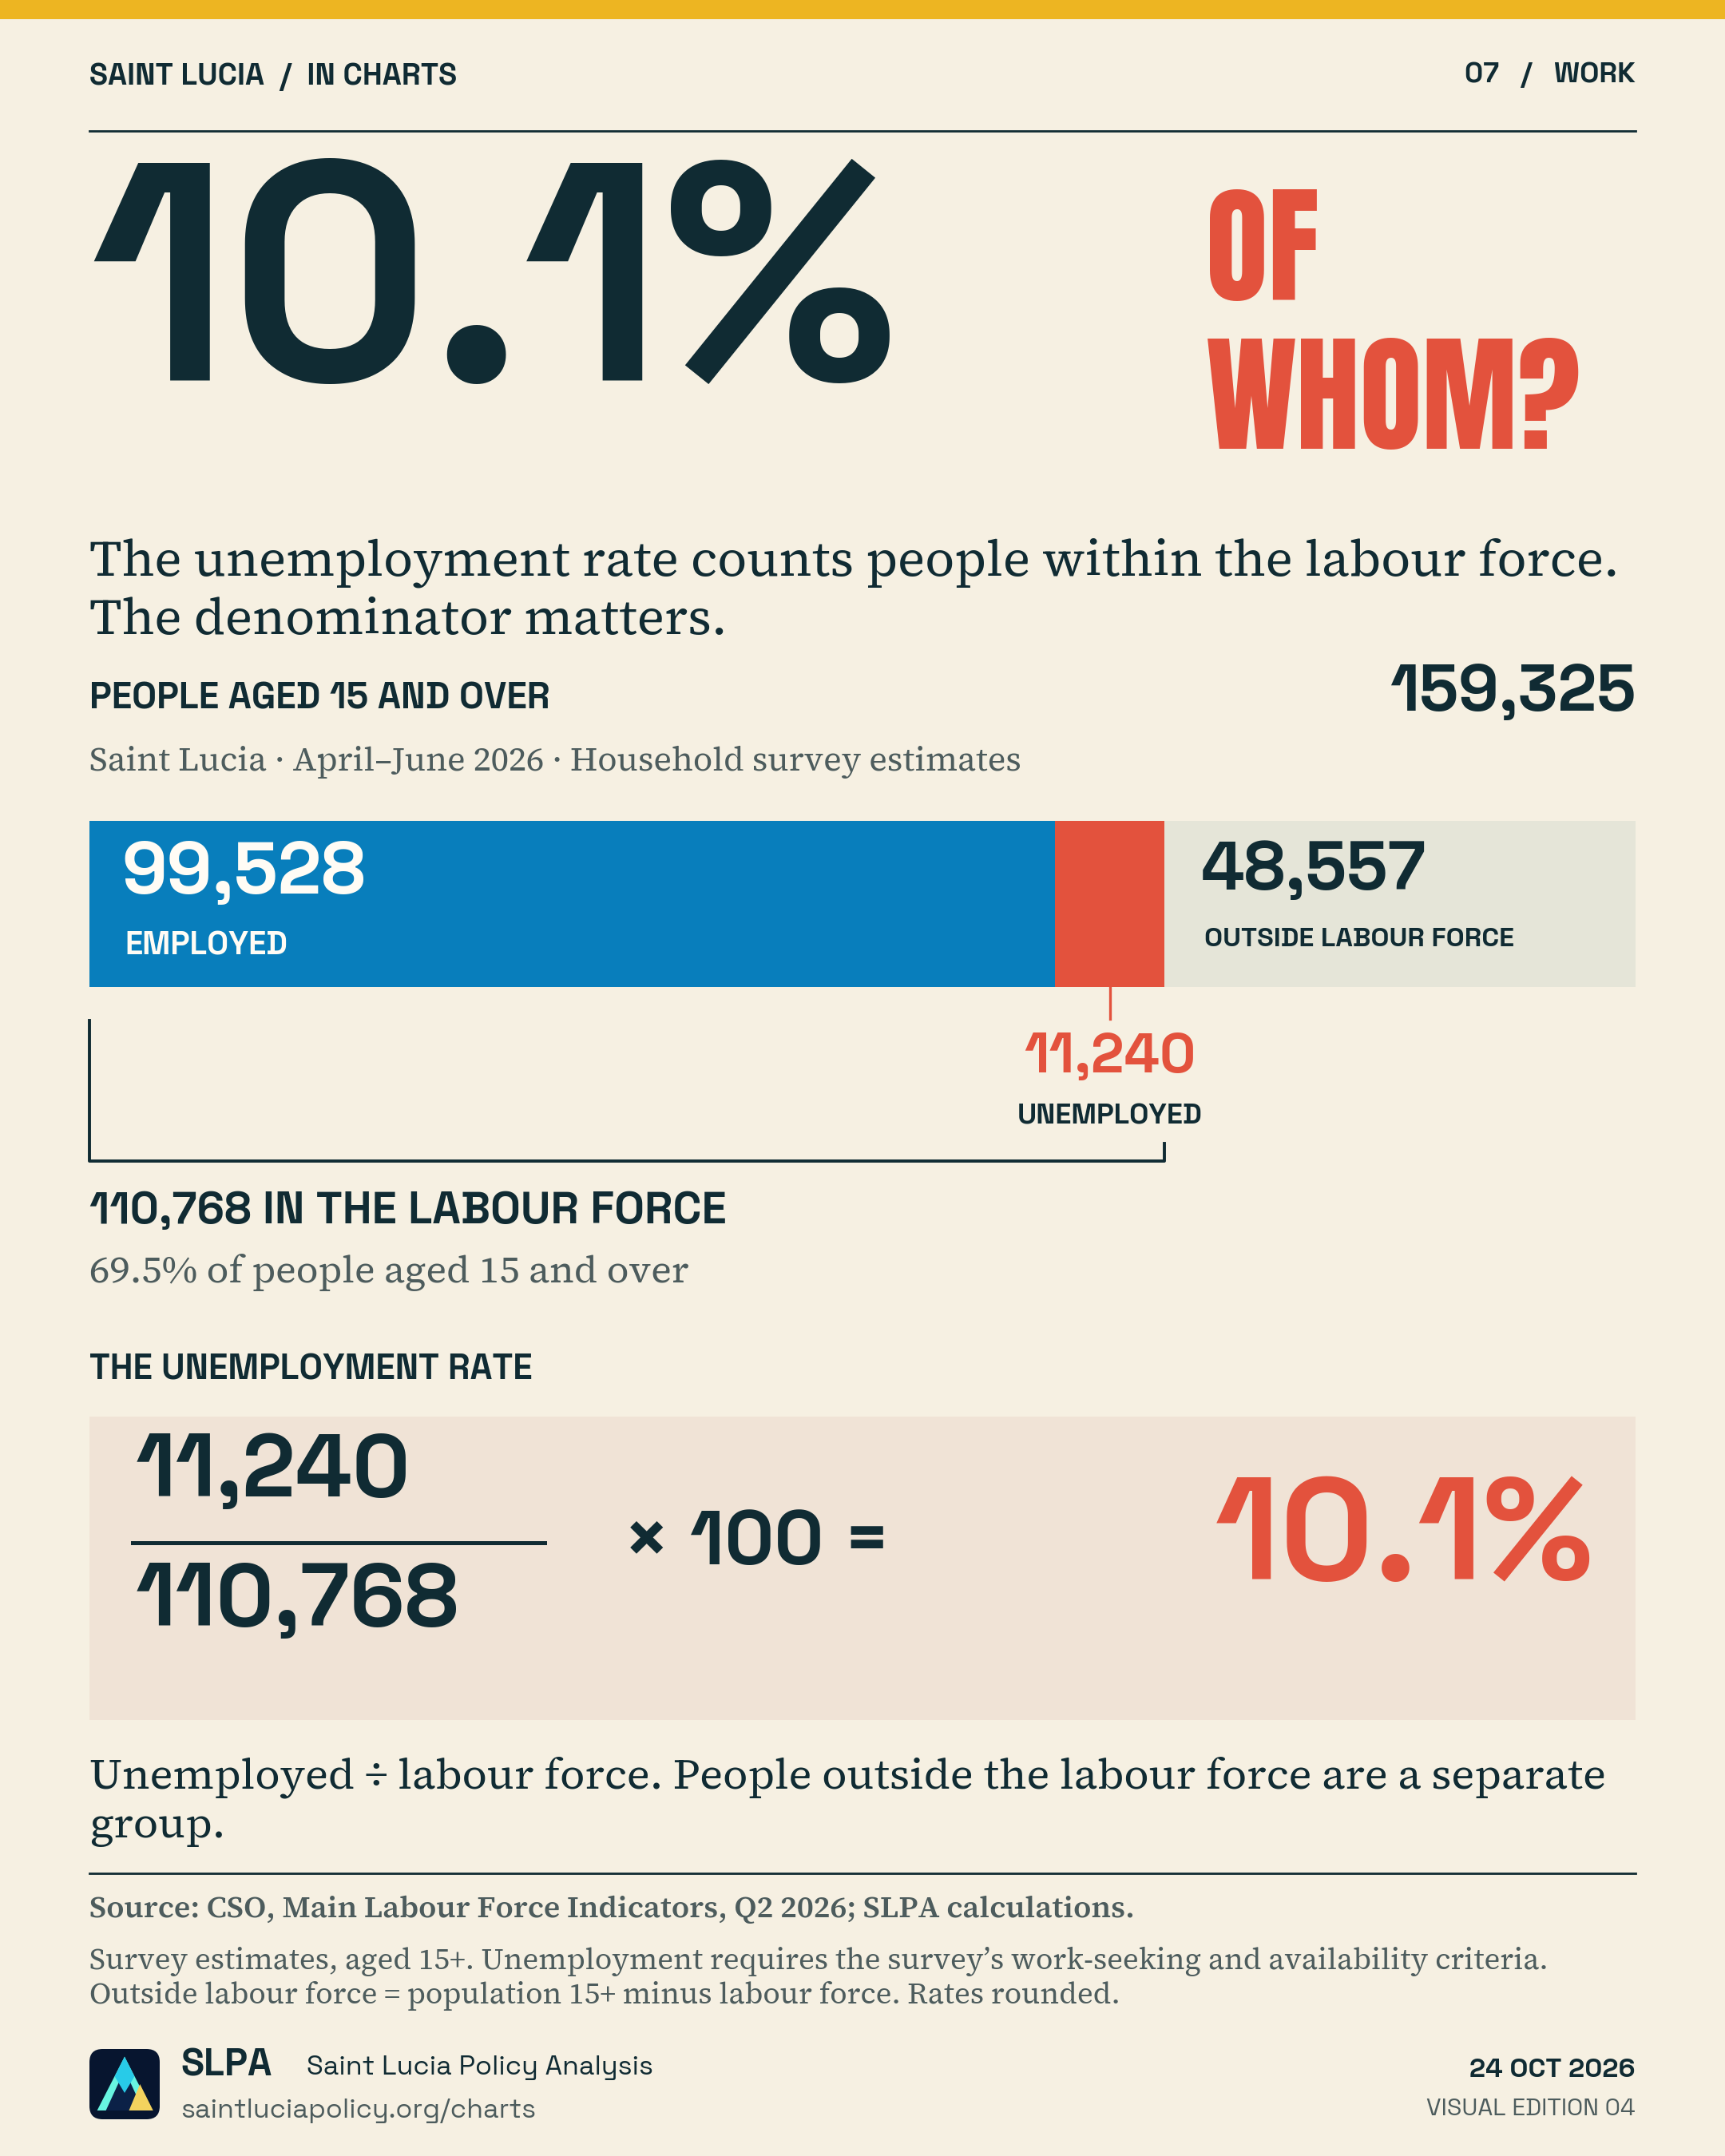
Read the graphic ↗ 07 WorkData chartNew · Edition 04
View graphic & sources ↗ April–June 2026
See who enters the 10.1% calculation, and why the denominator matters.
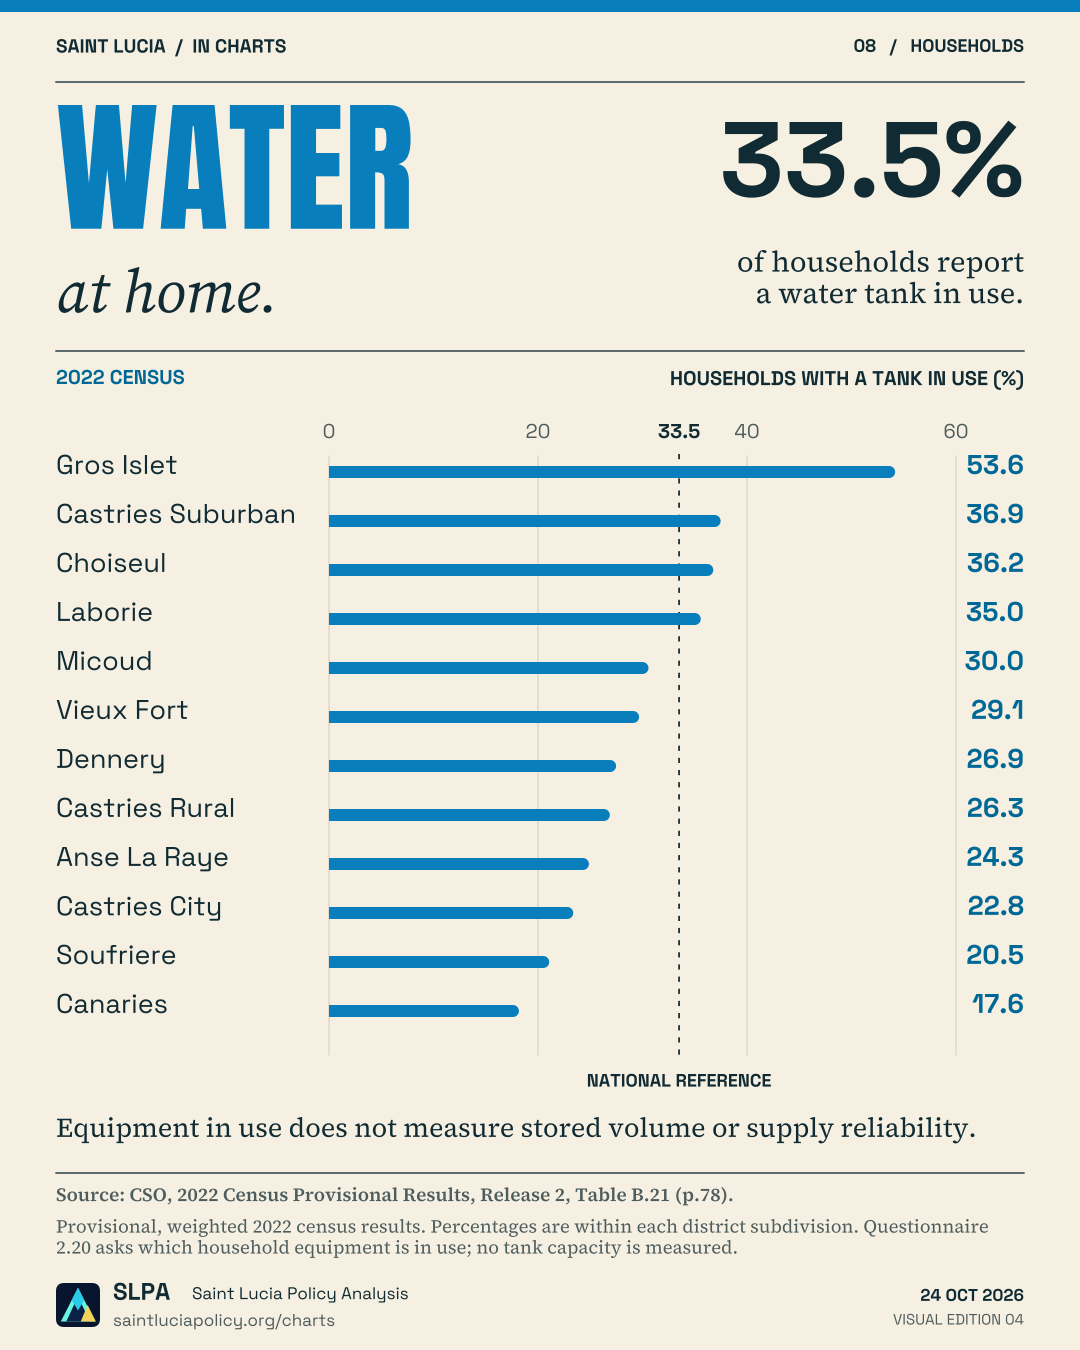
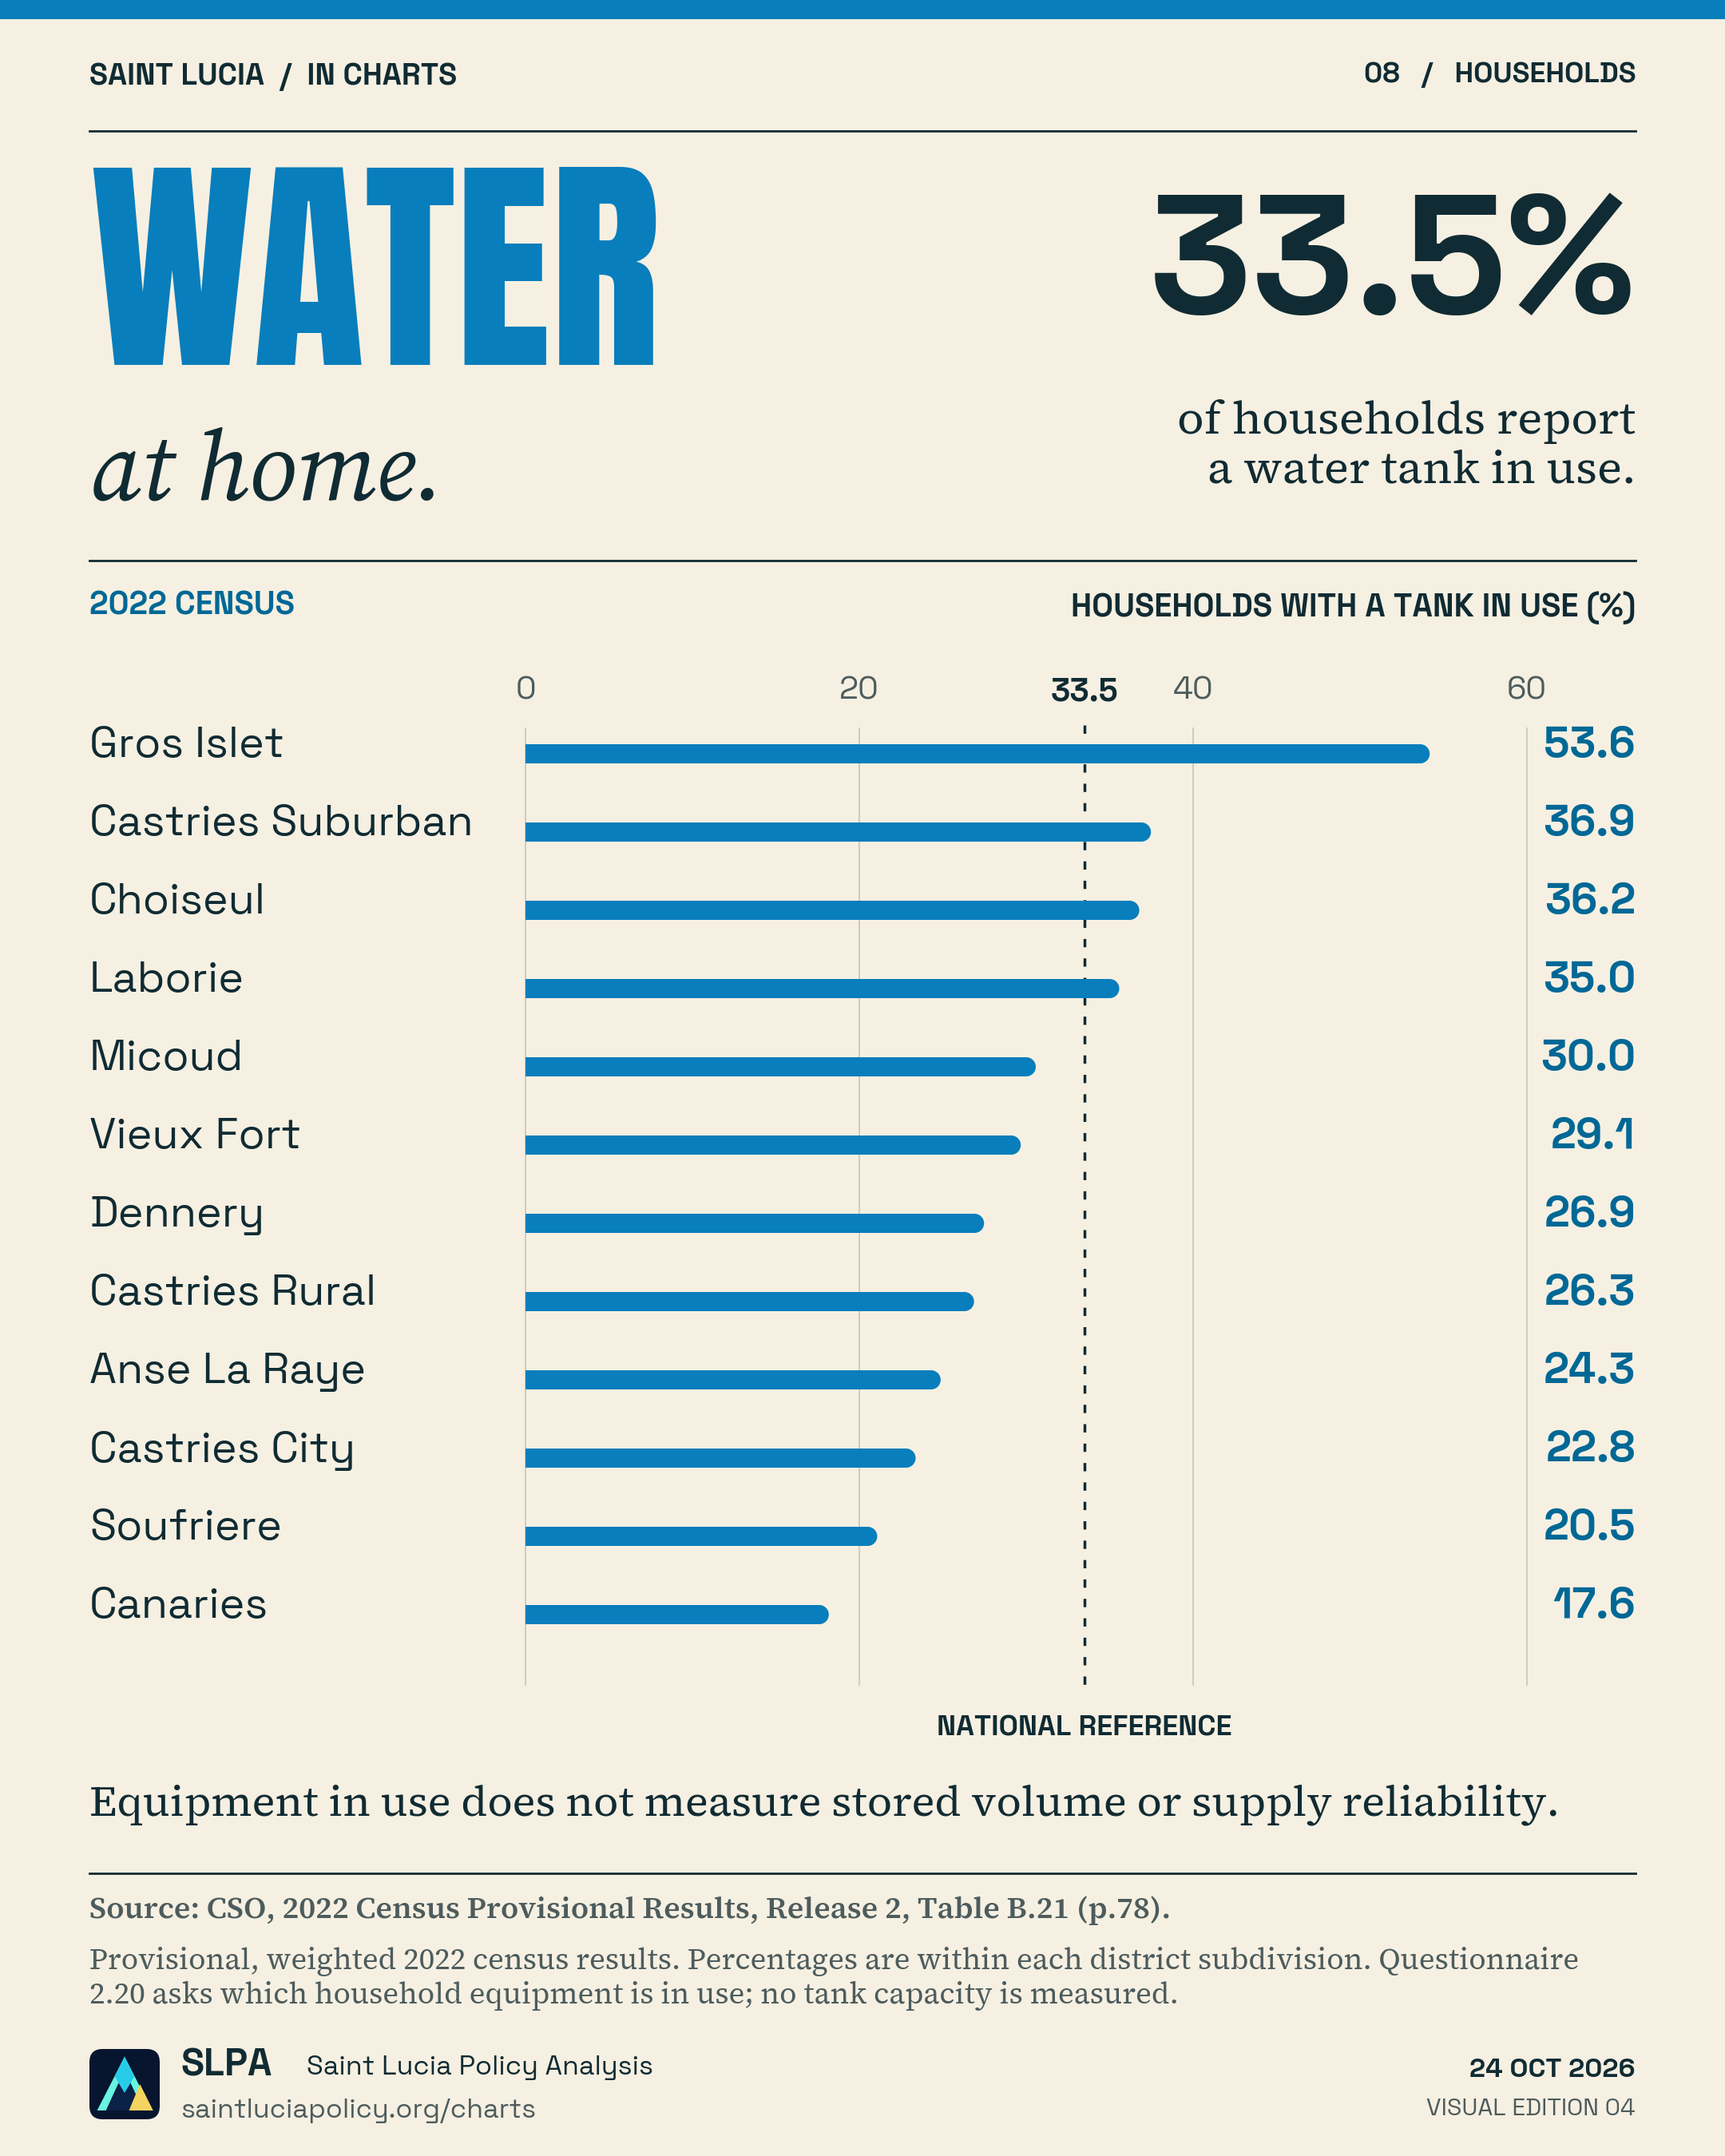
08 HouseholdsData chartNew · Edition 04
View graphic & sources ↗ 2022 census
Compare households reporting a water tank in use across Saint Lucia’s 12 census districts.
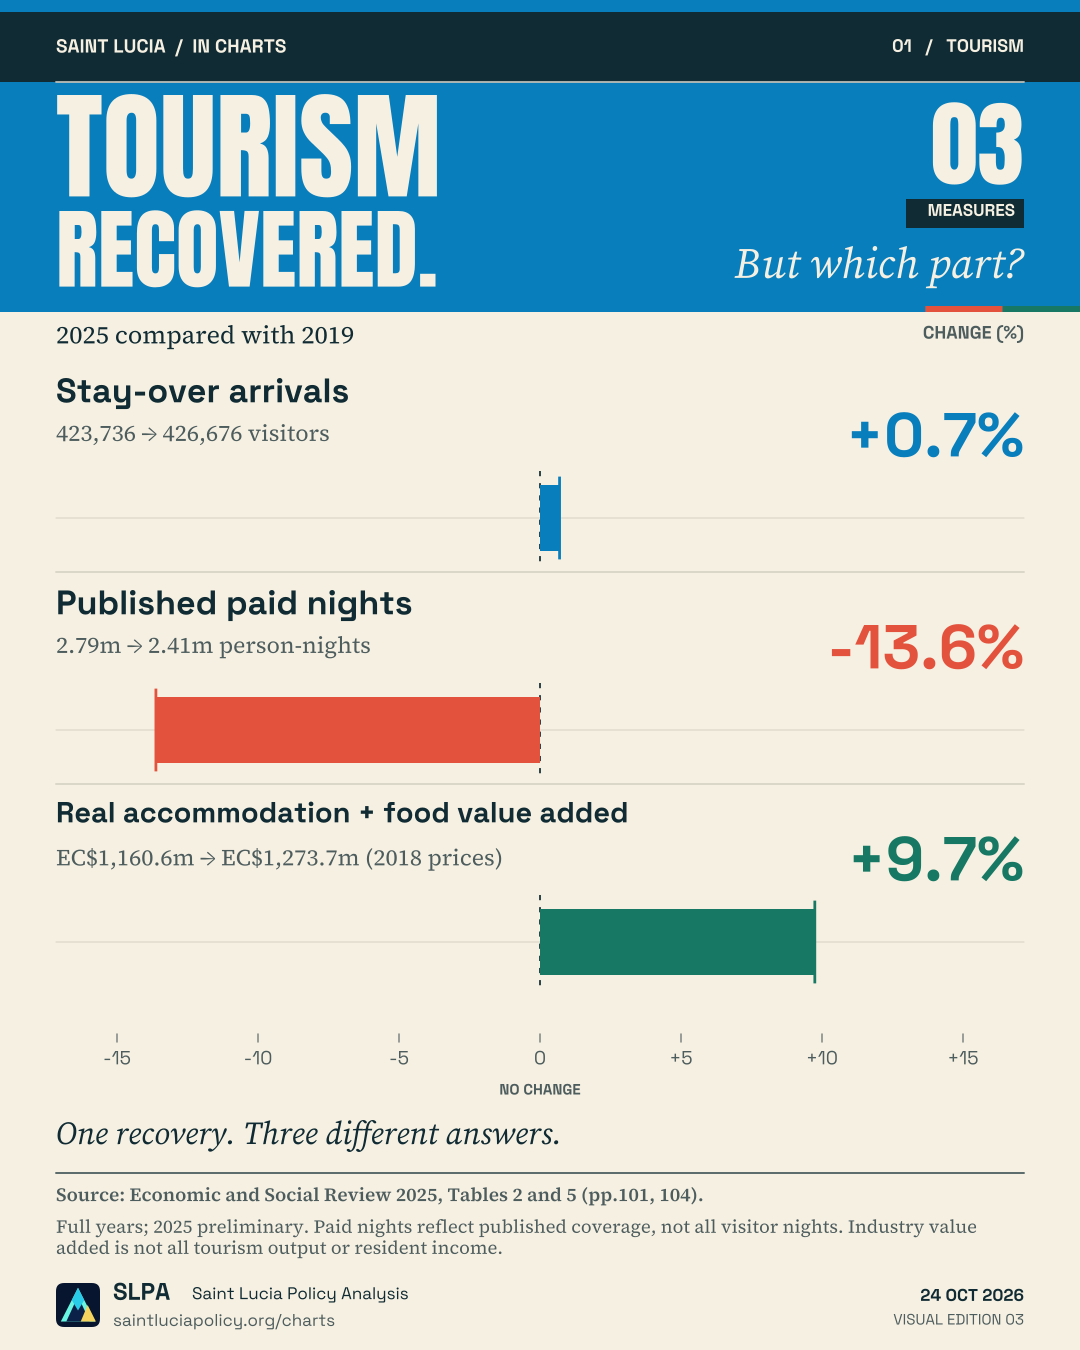
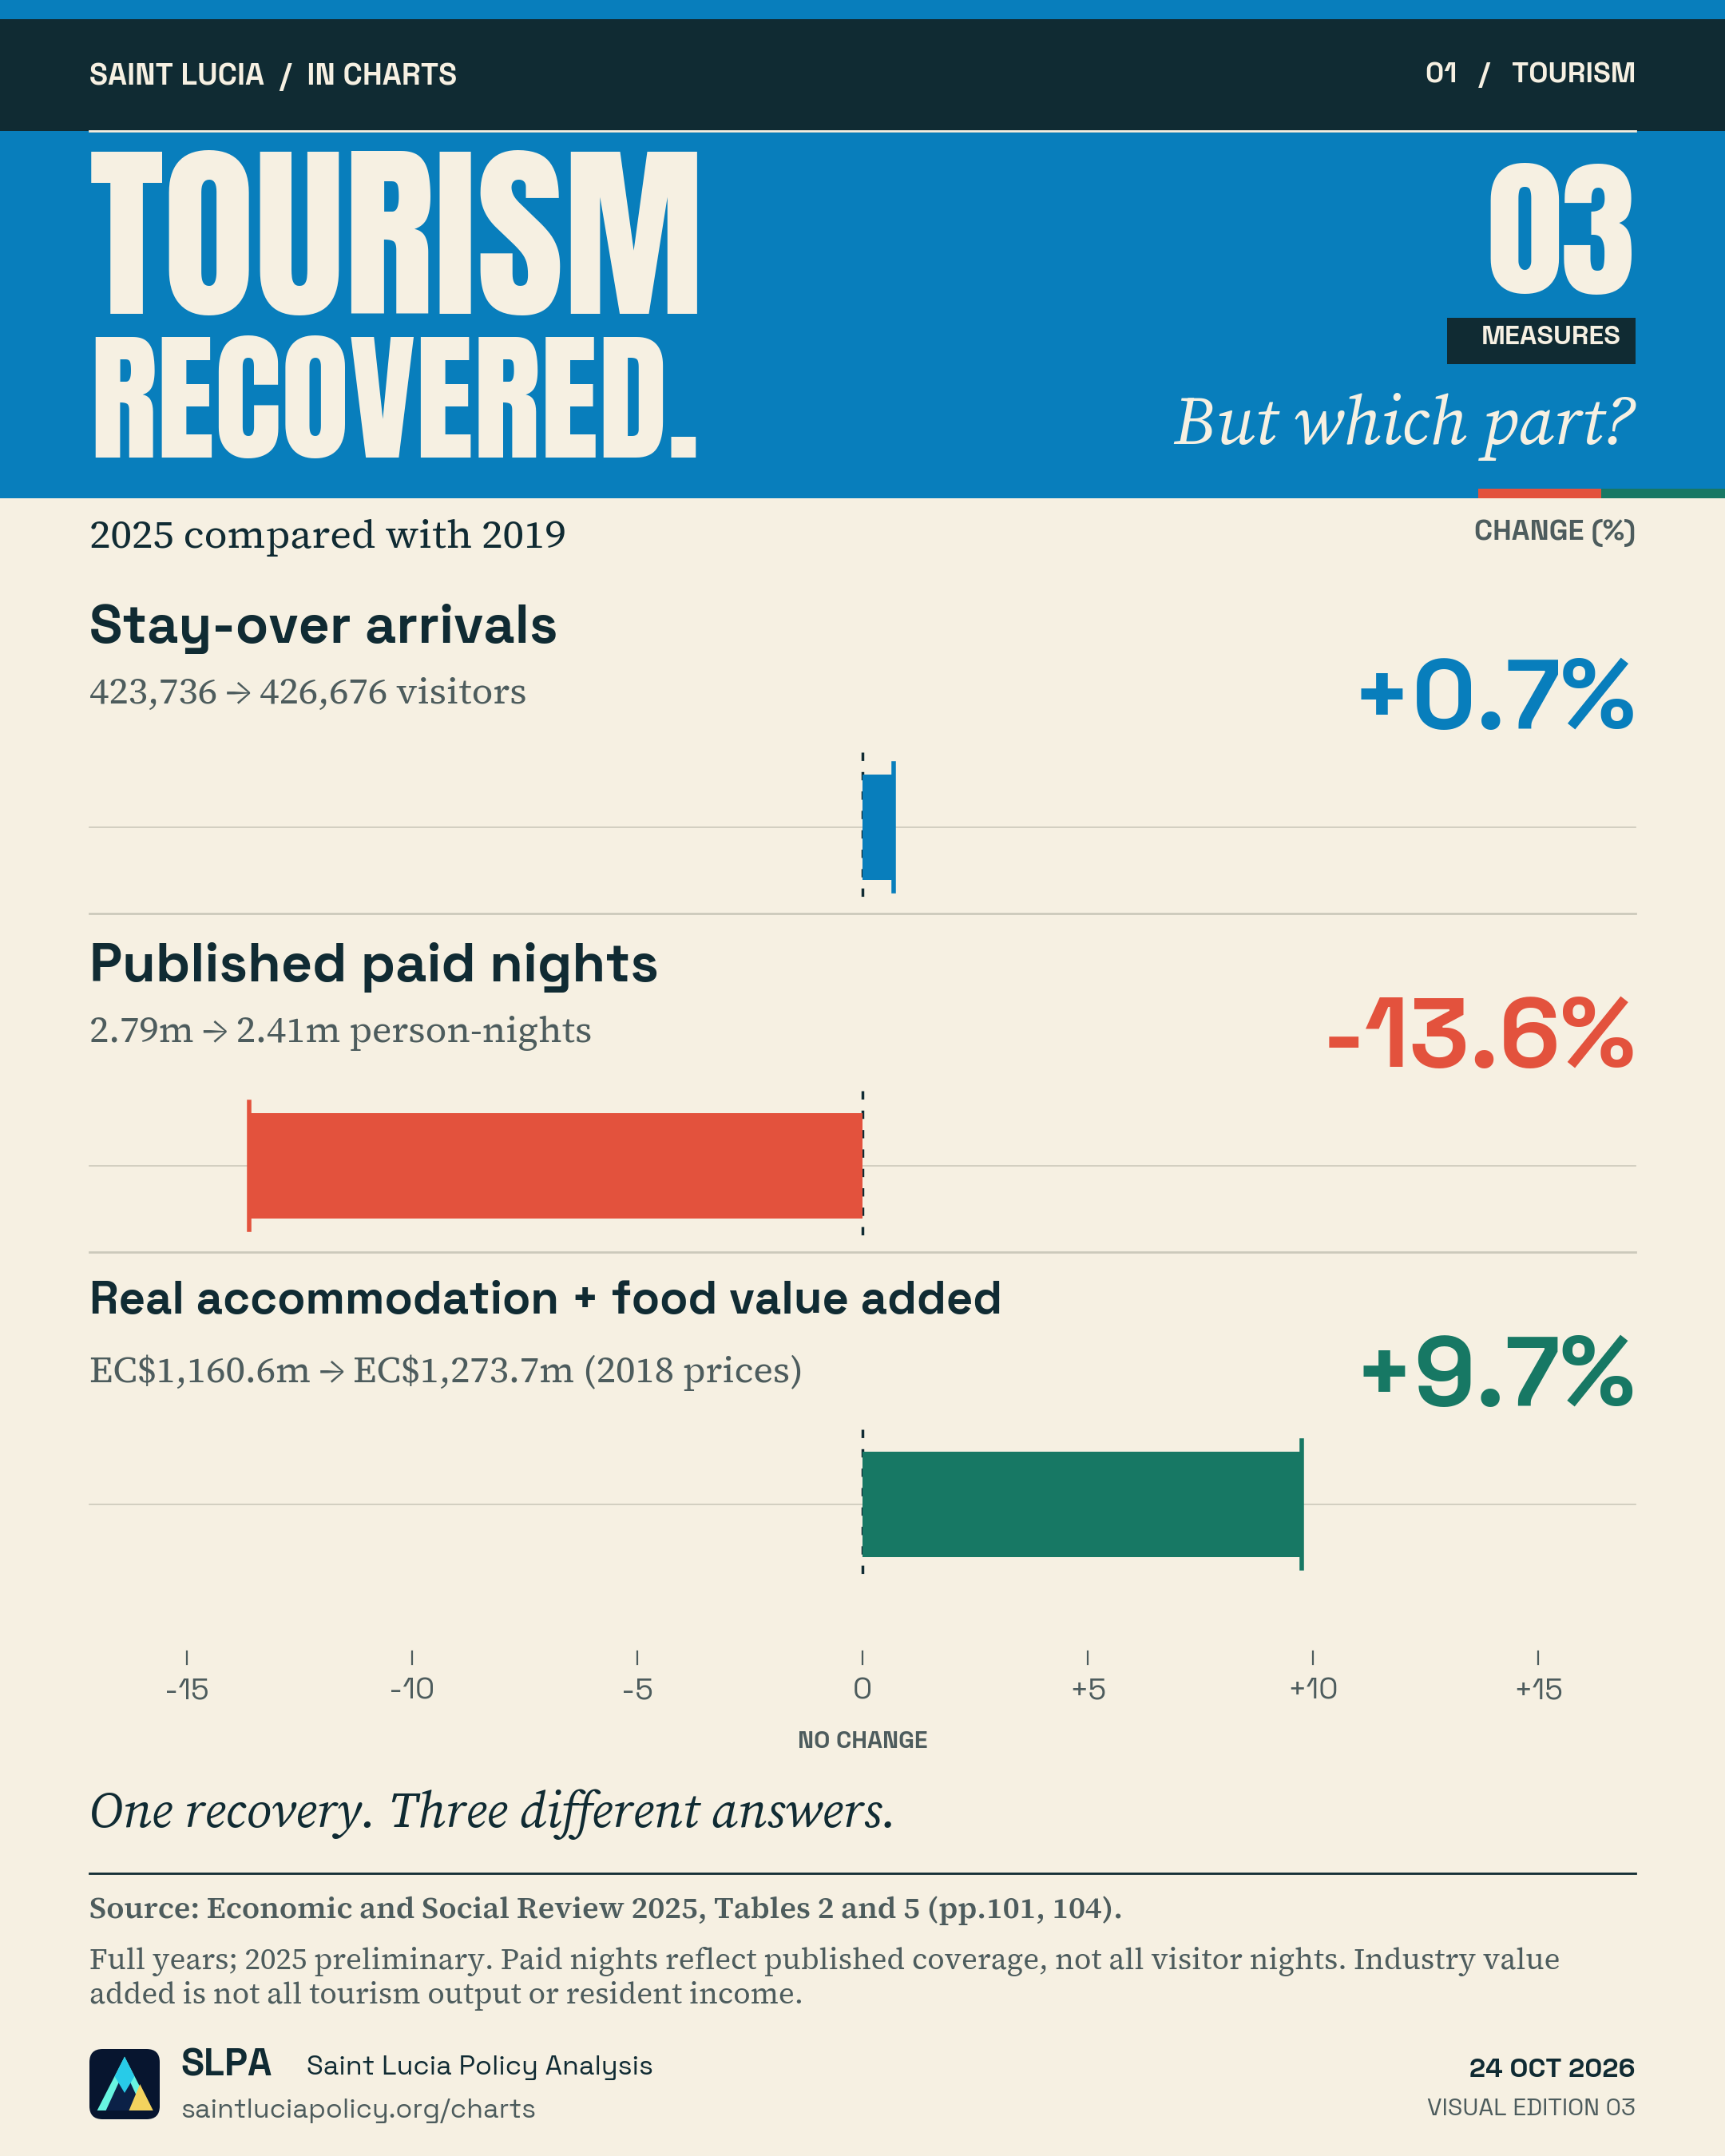
01 TourismData chart
View graphic & sources ↗ 2019 and 2025
Visitors, paid nights and real production tell different parts of the recovery story.
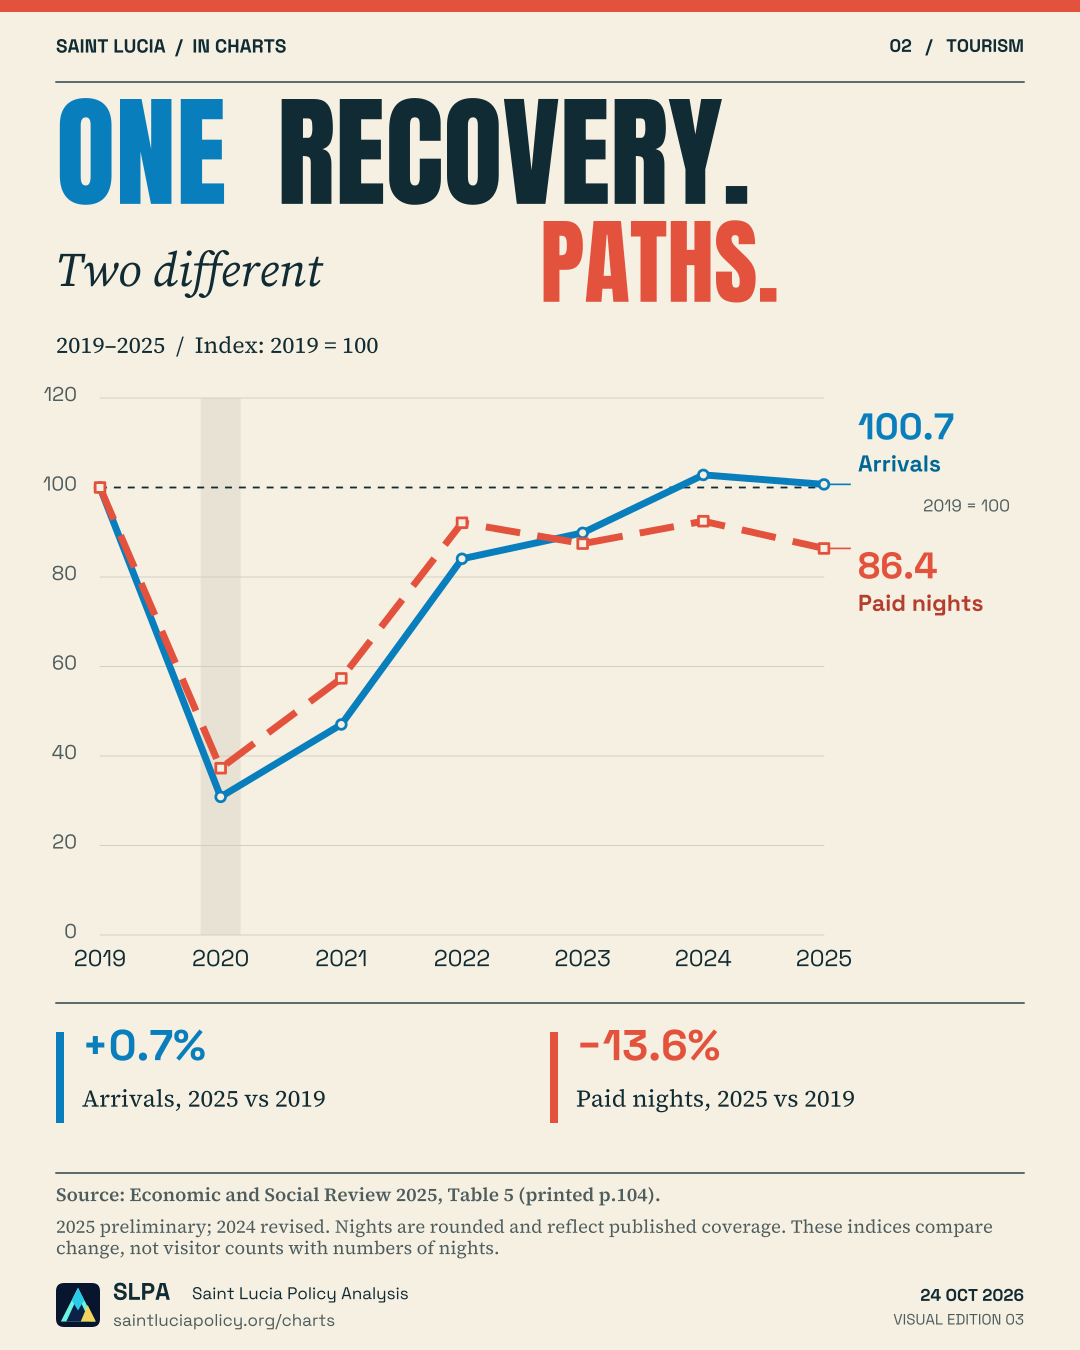
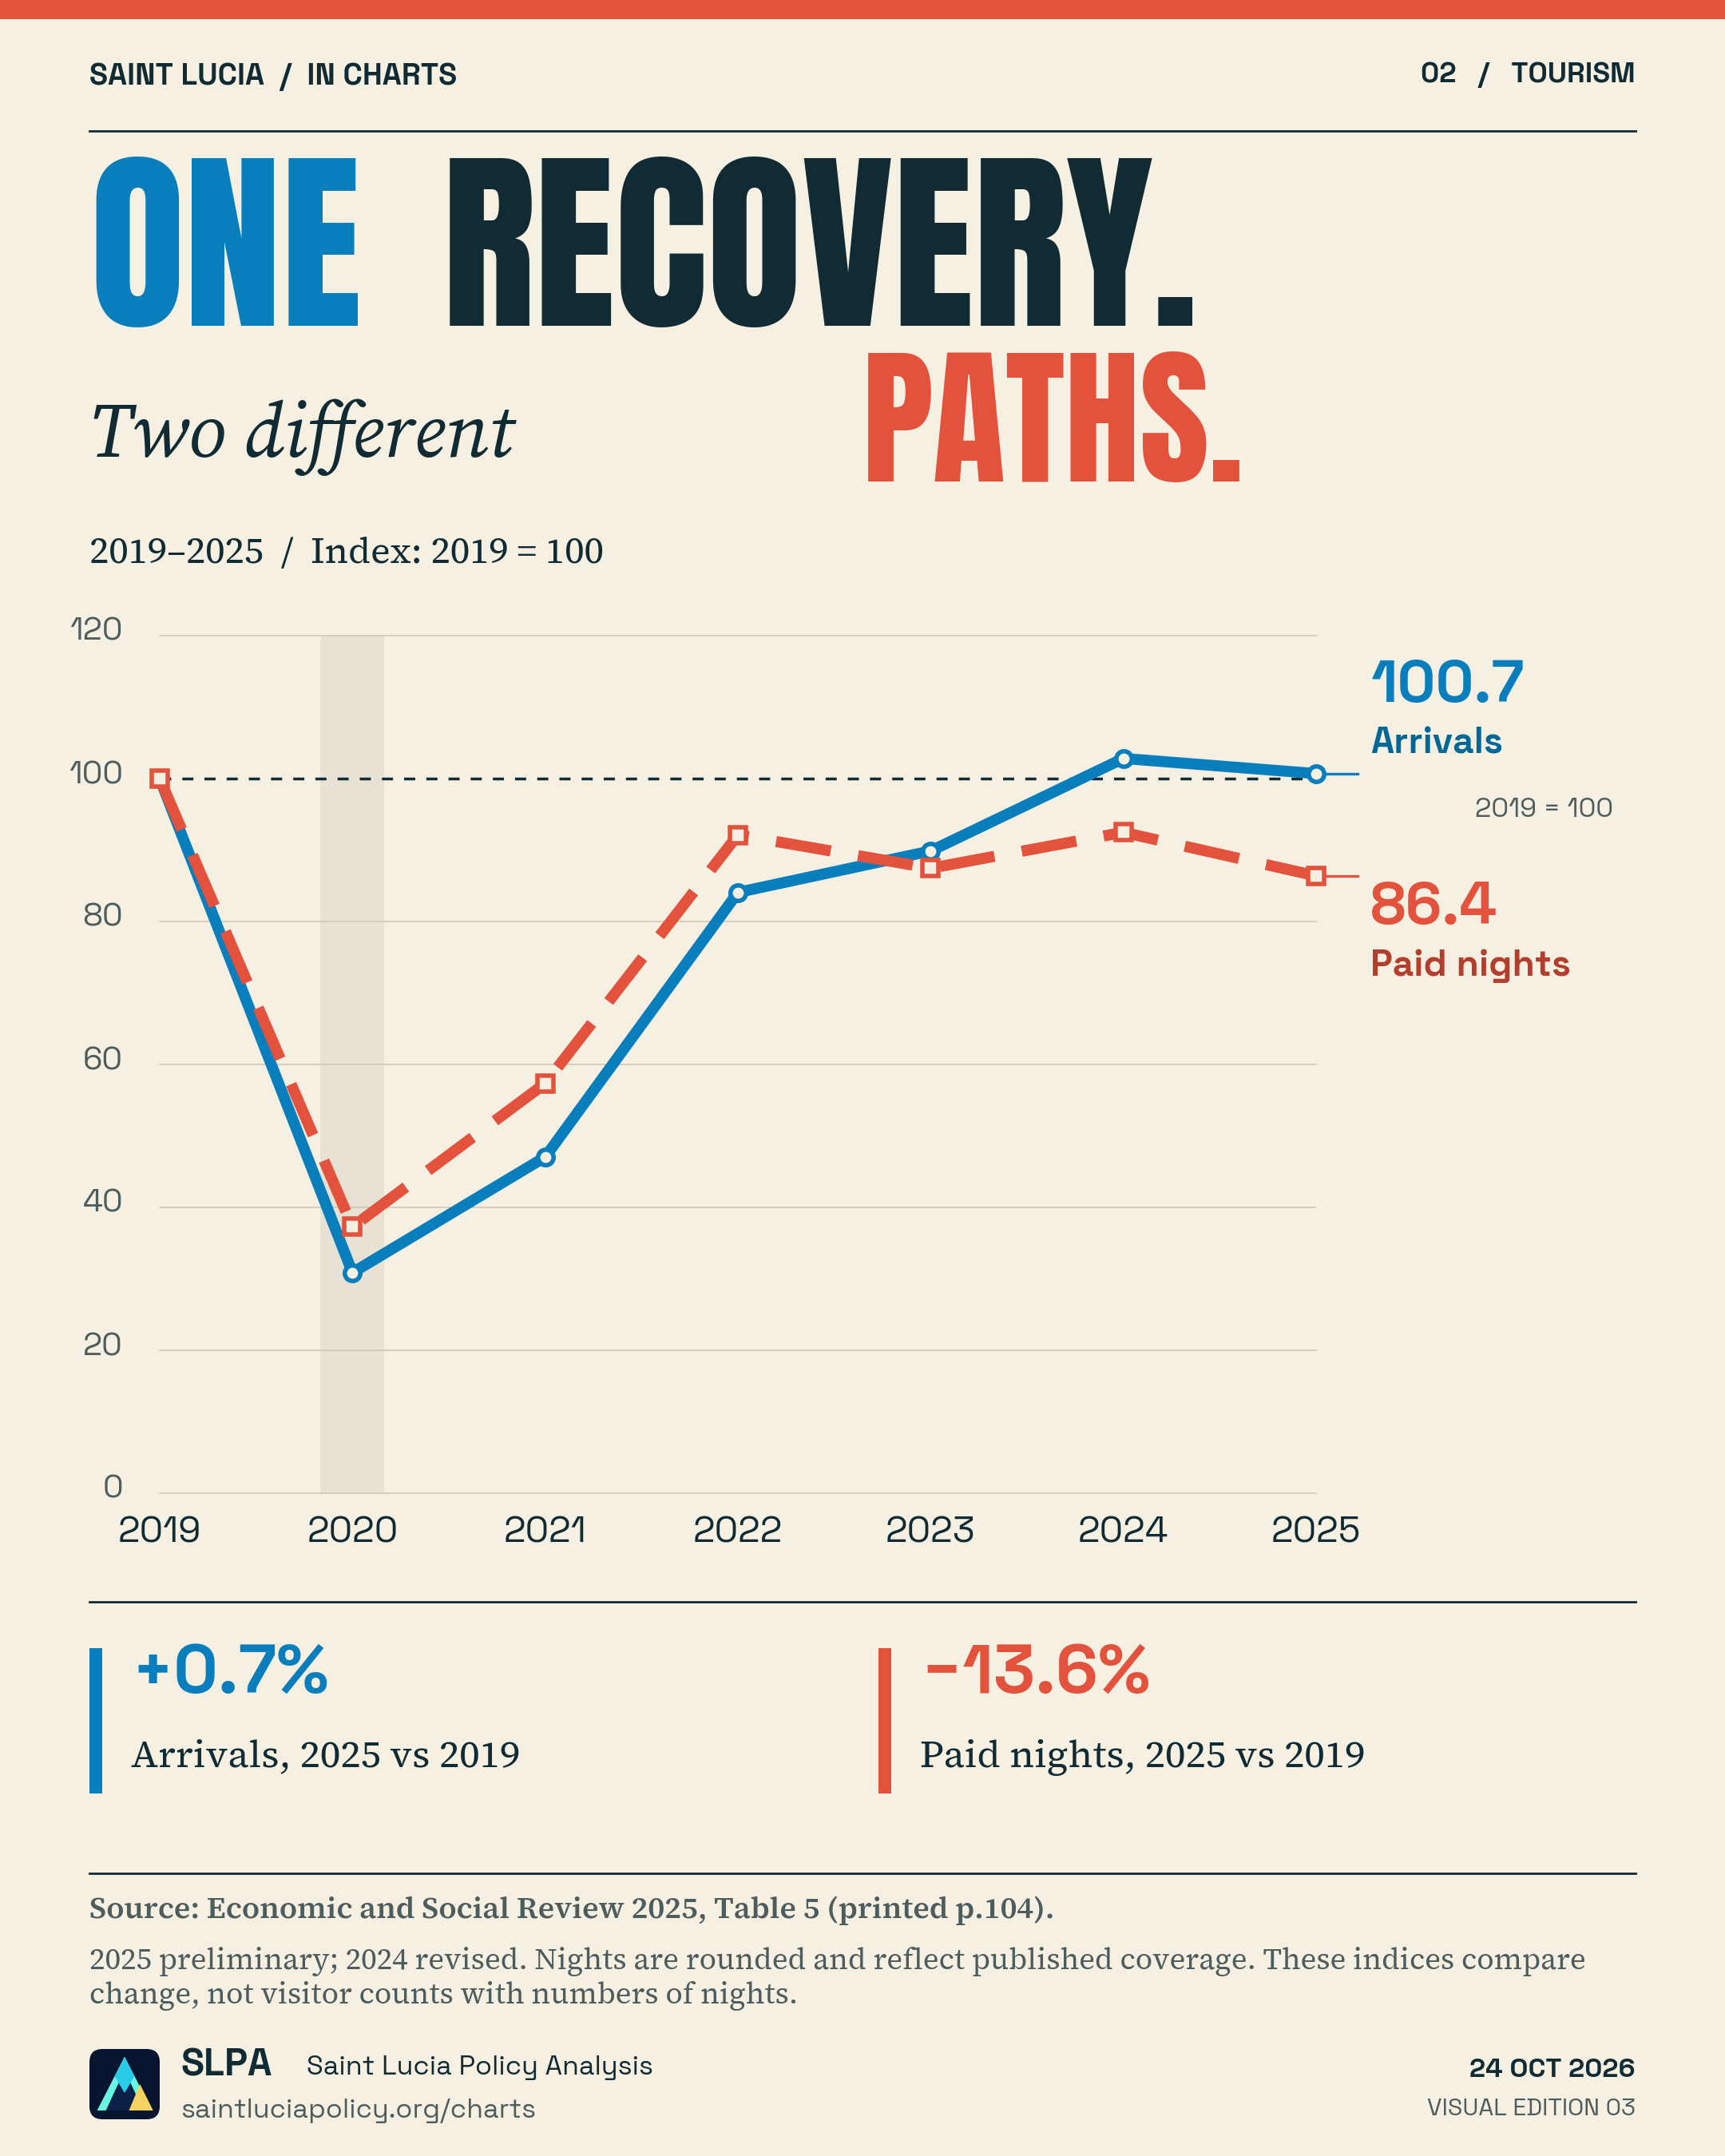
02 TourismData chart
View graphic & sources ↗ 2019–2025
Follow arrivals and published paid nights through the pandemic and recovery.
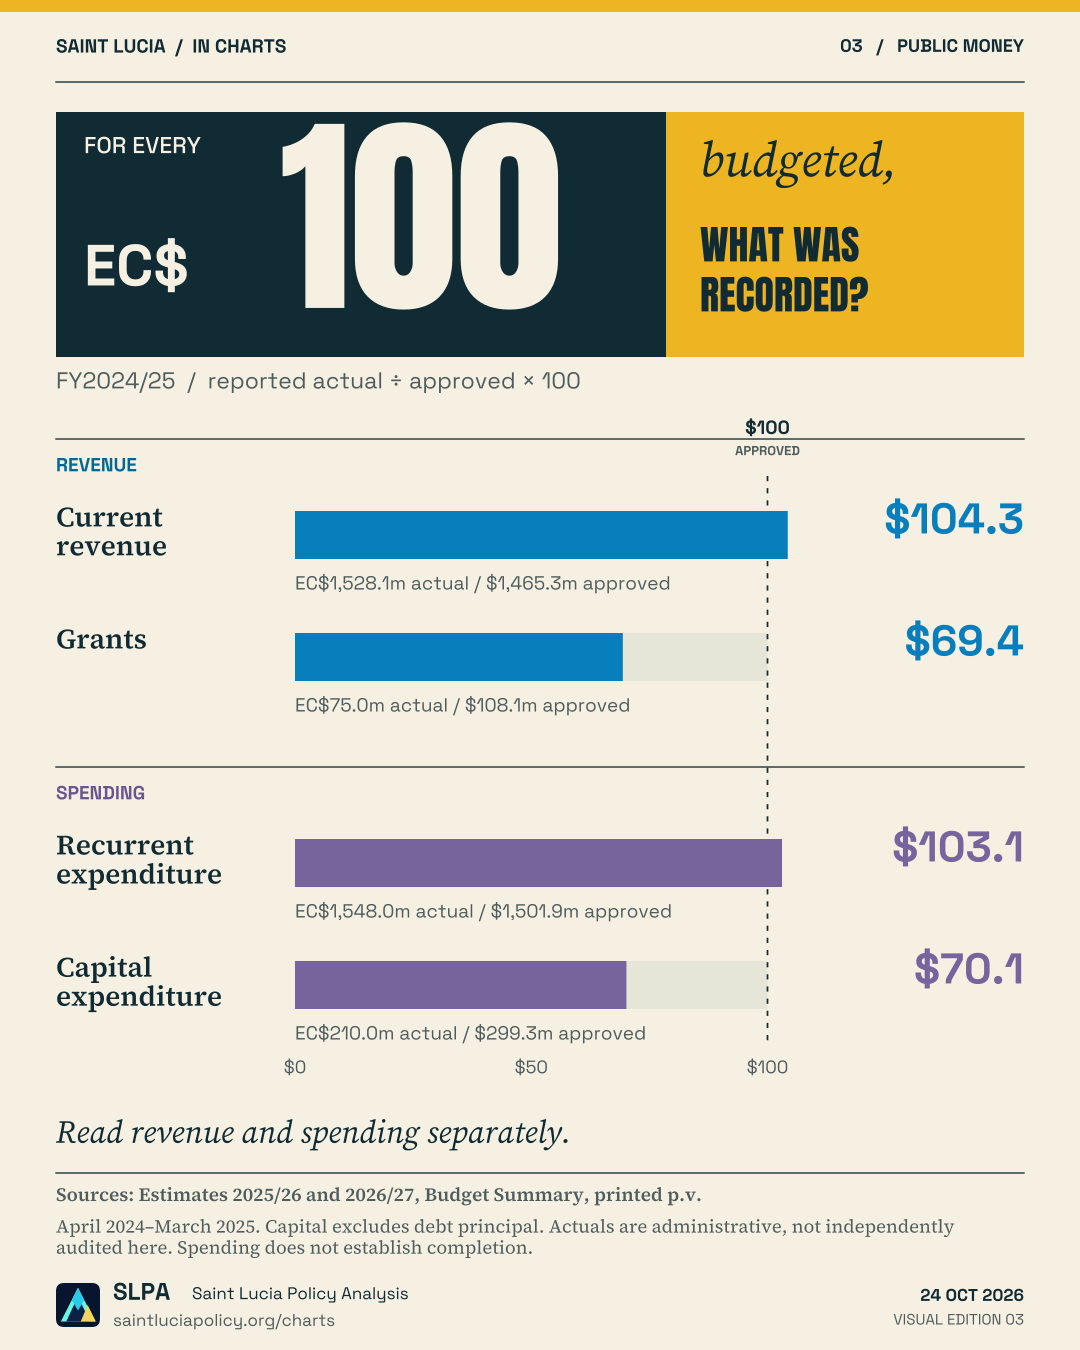
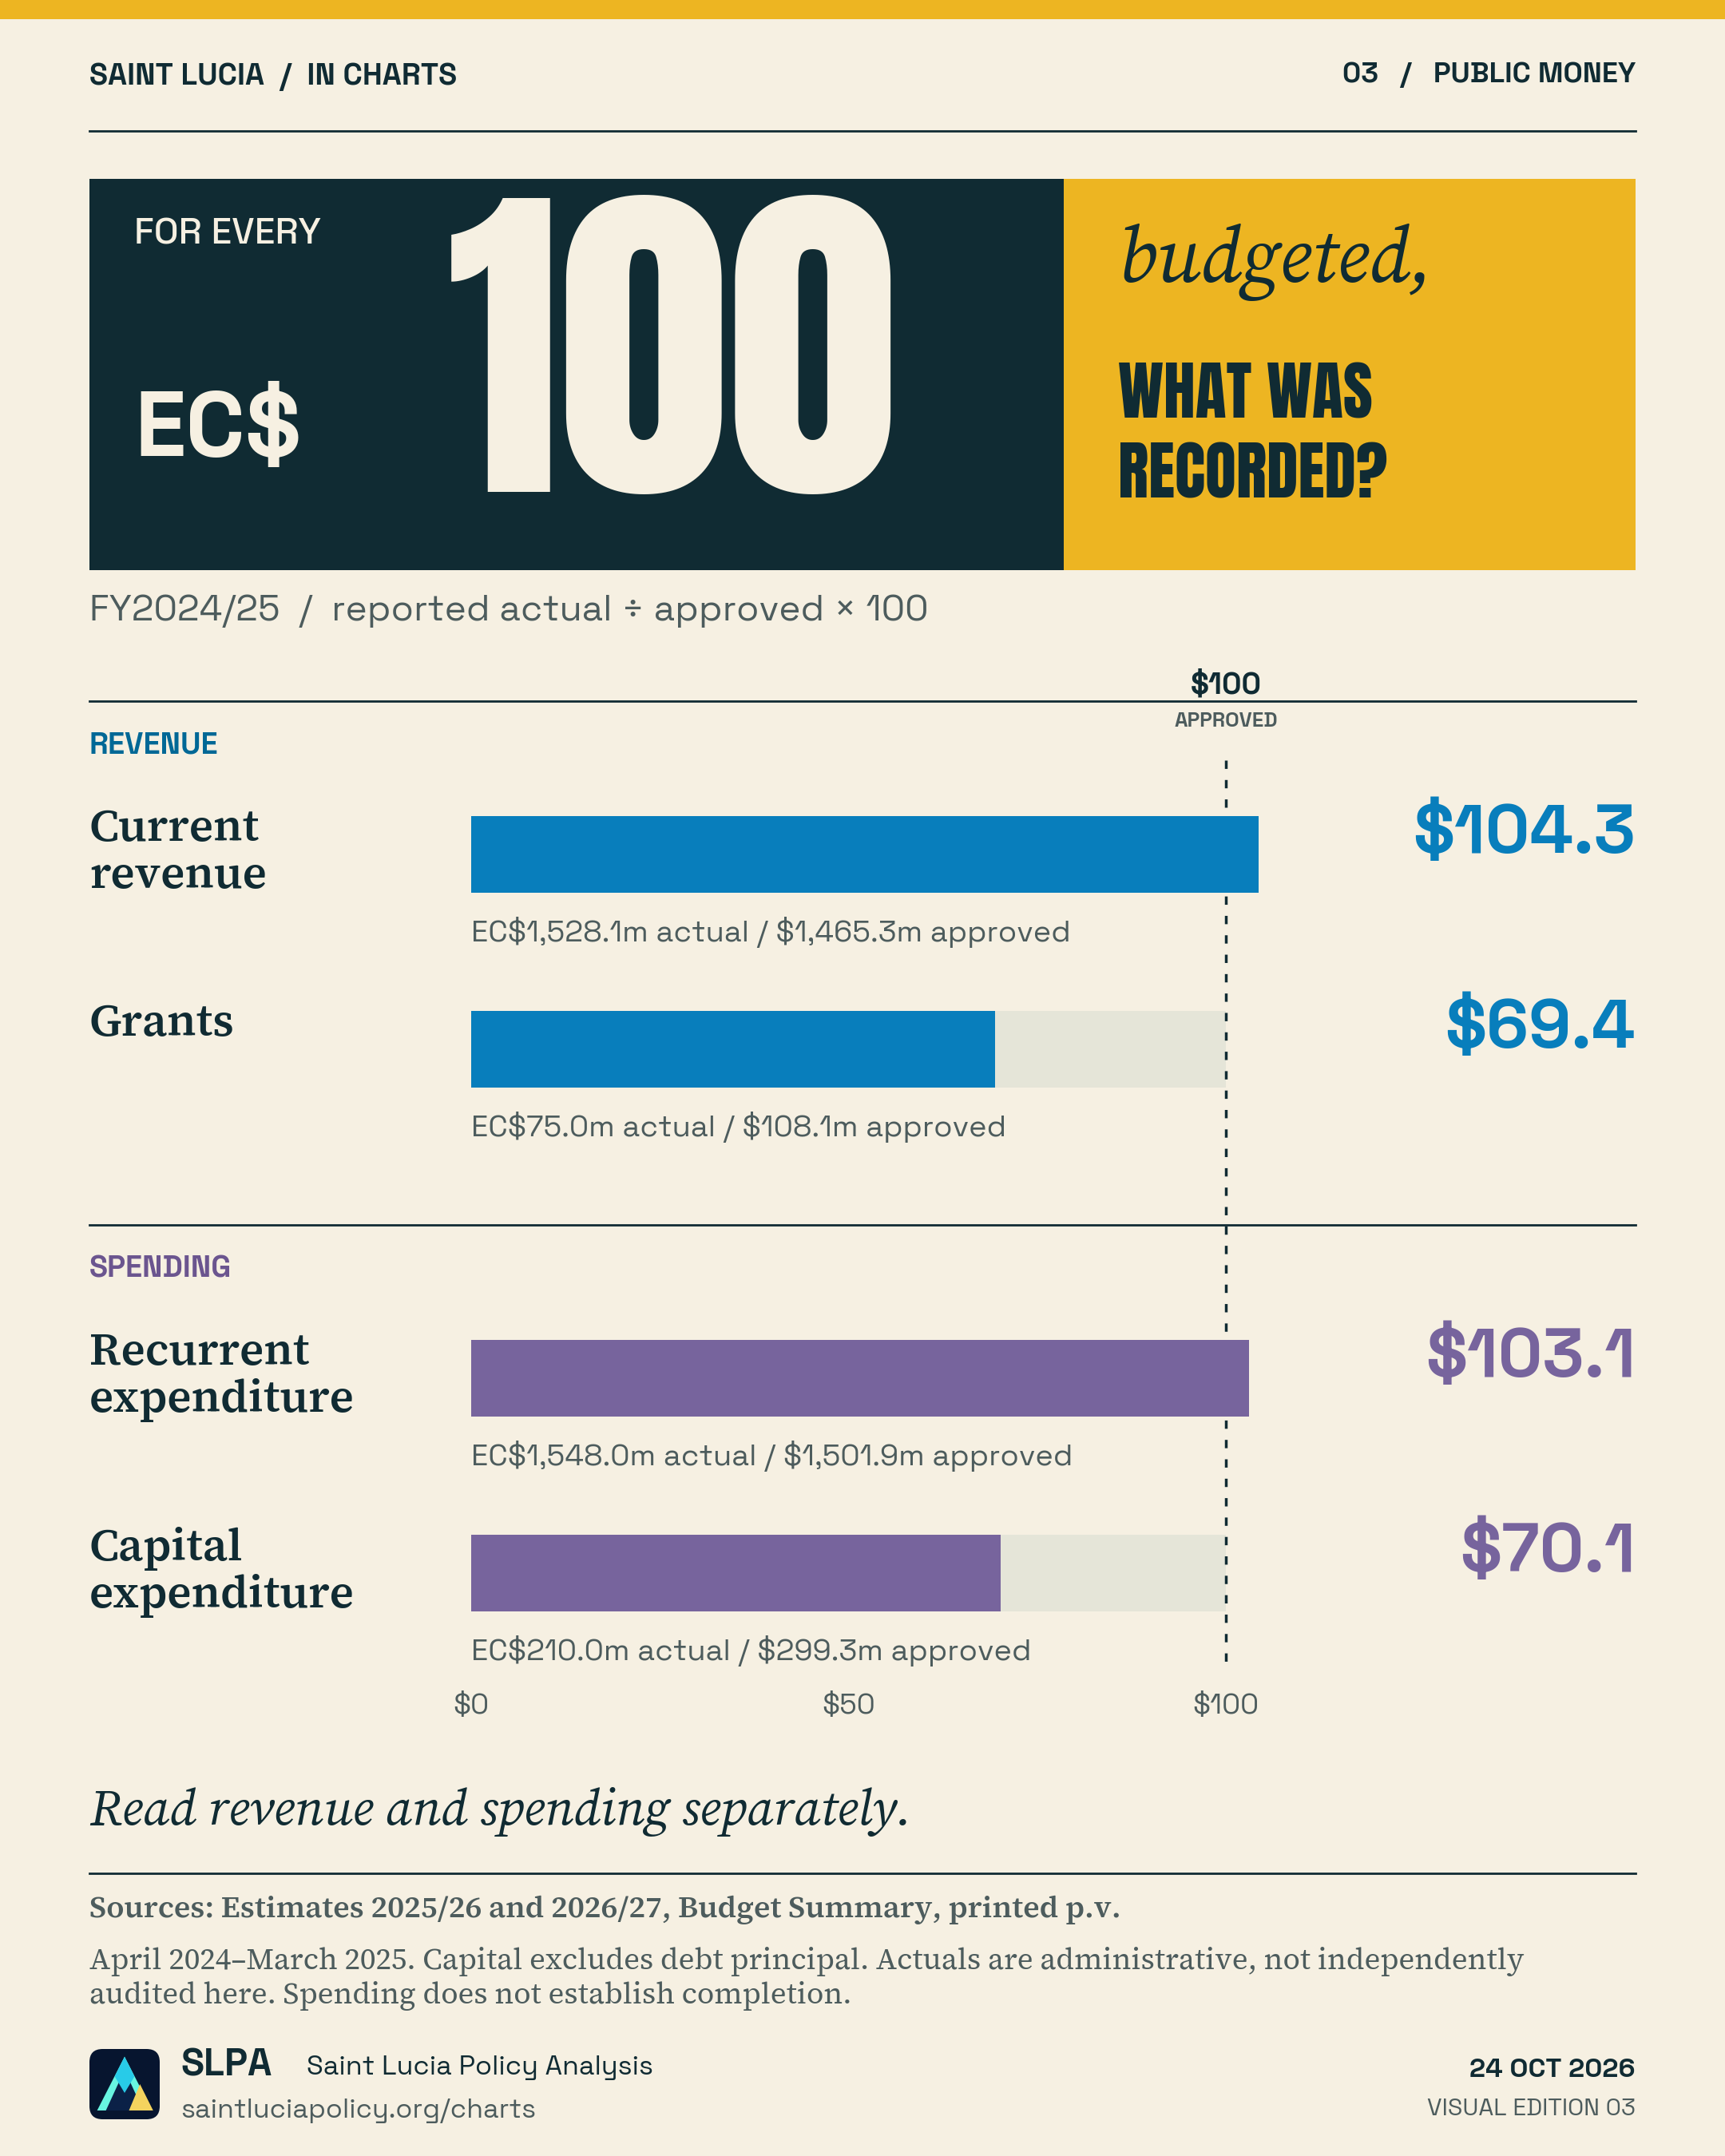
Explore the years ↗ 03 Public moneyData chart
View graphic & sources ↗ FY2024/25
Compare approved plans with the recorded outturn for a completed financial year.
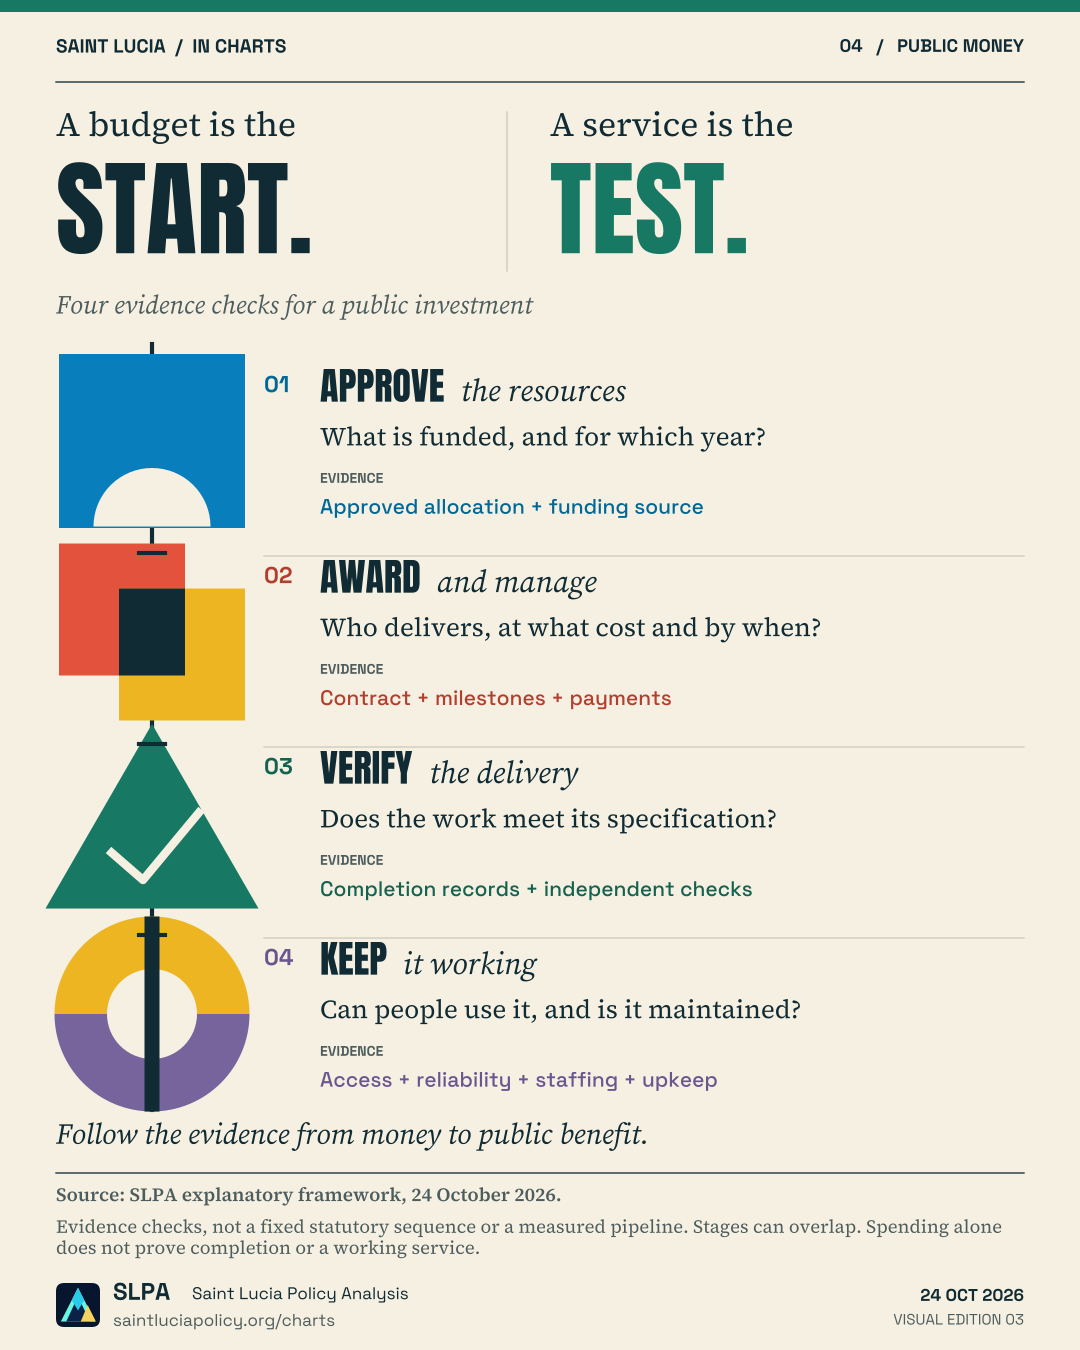
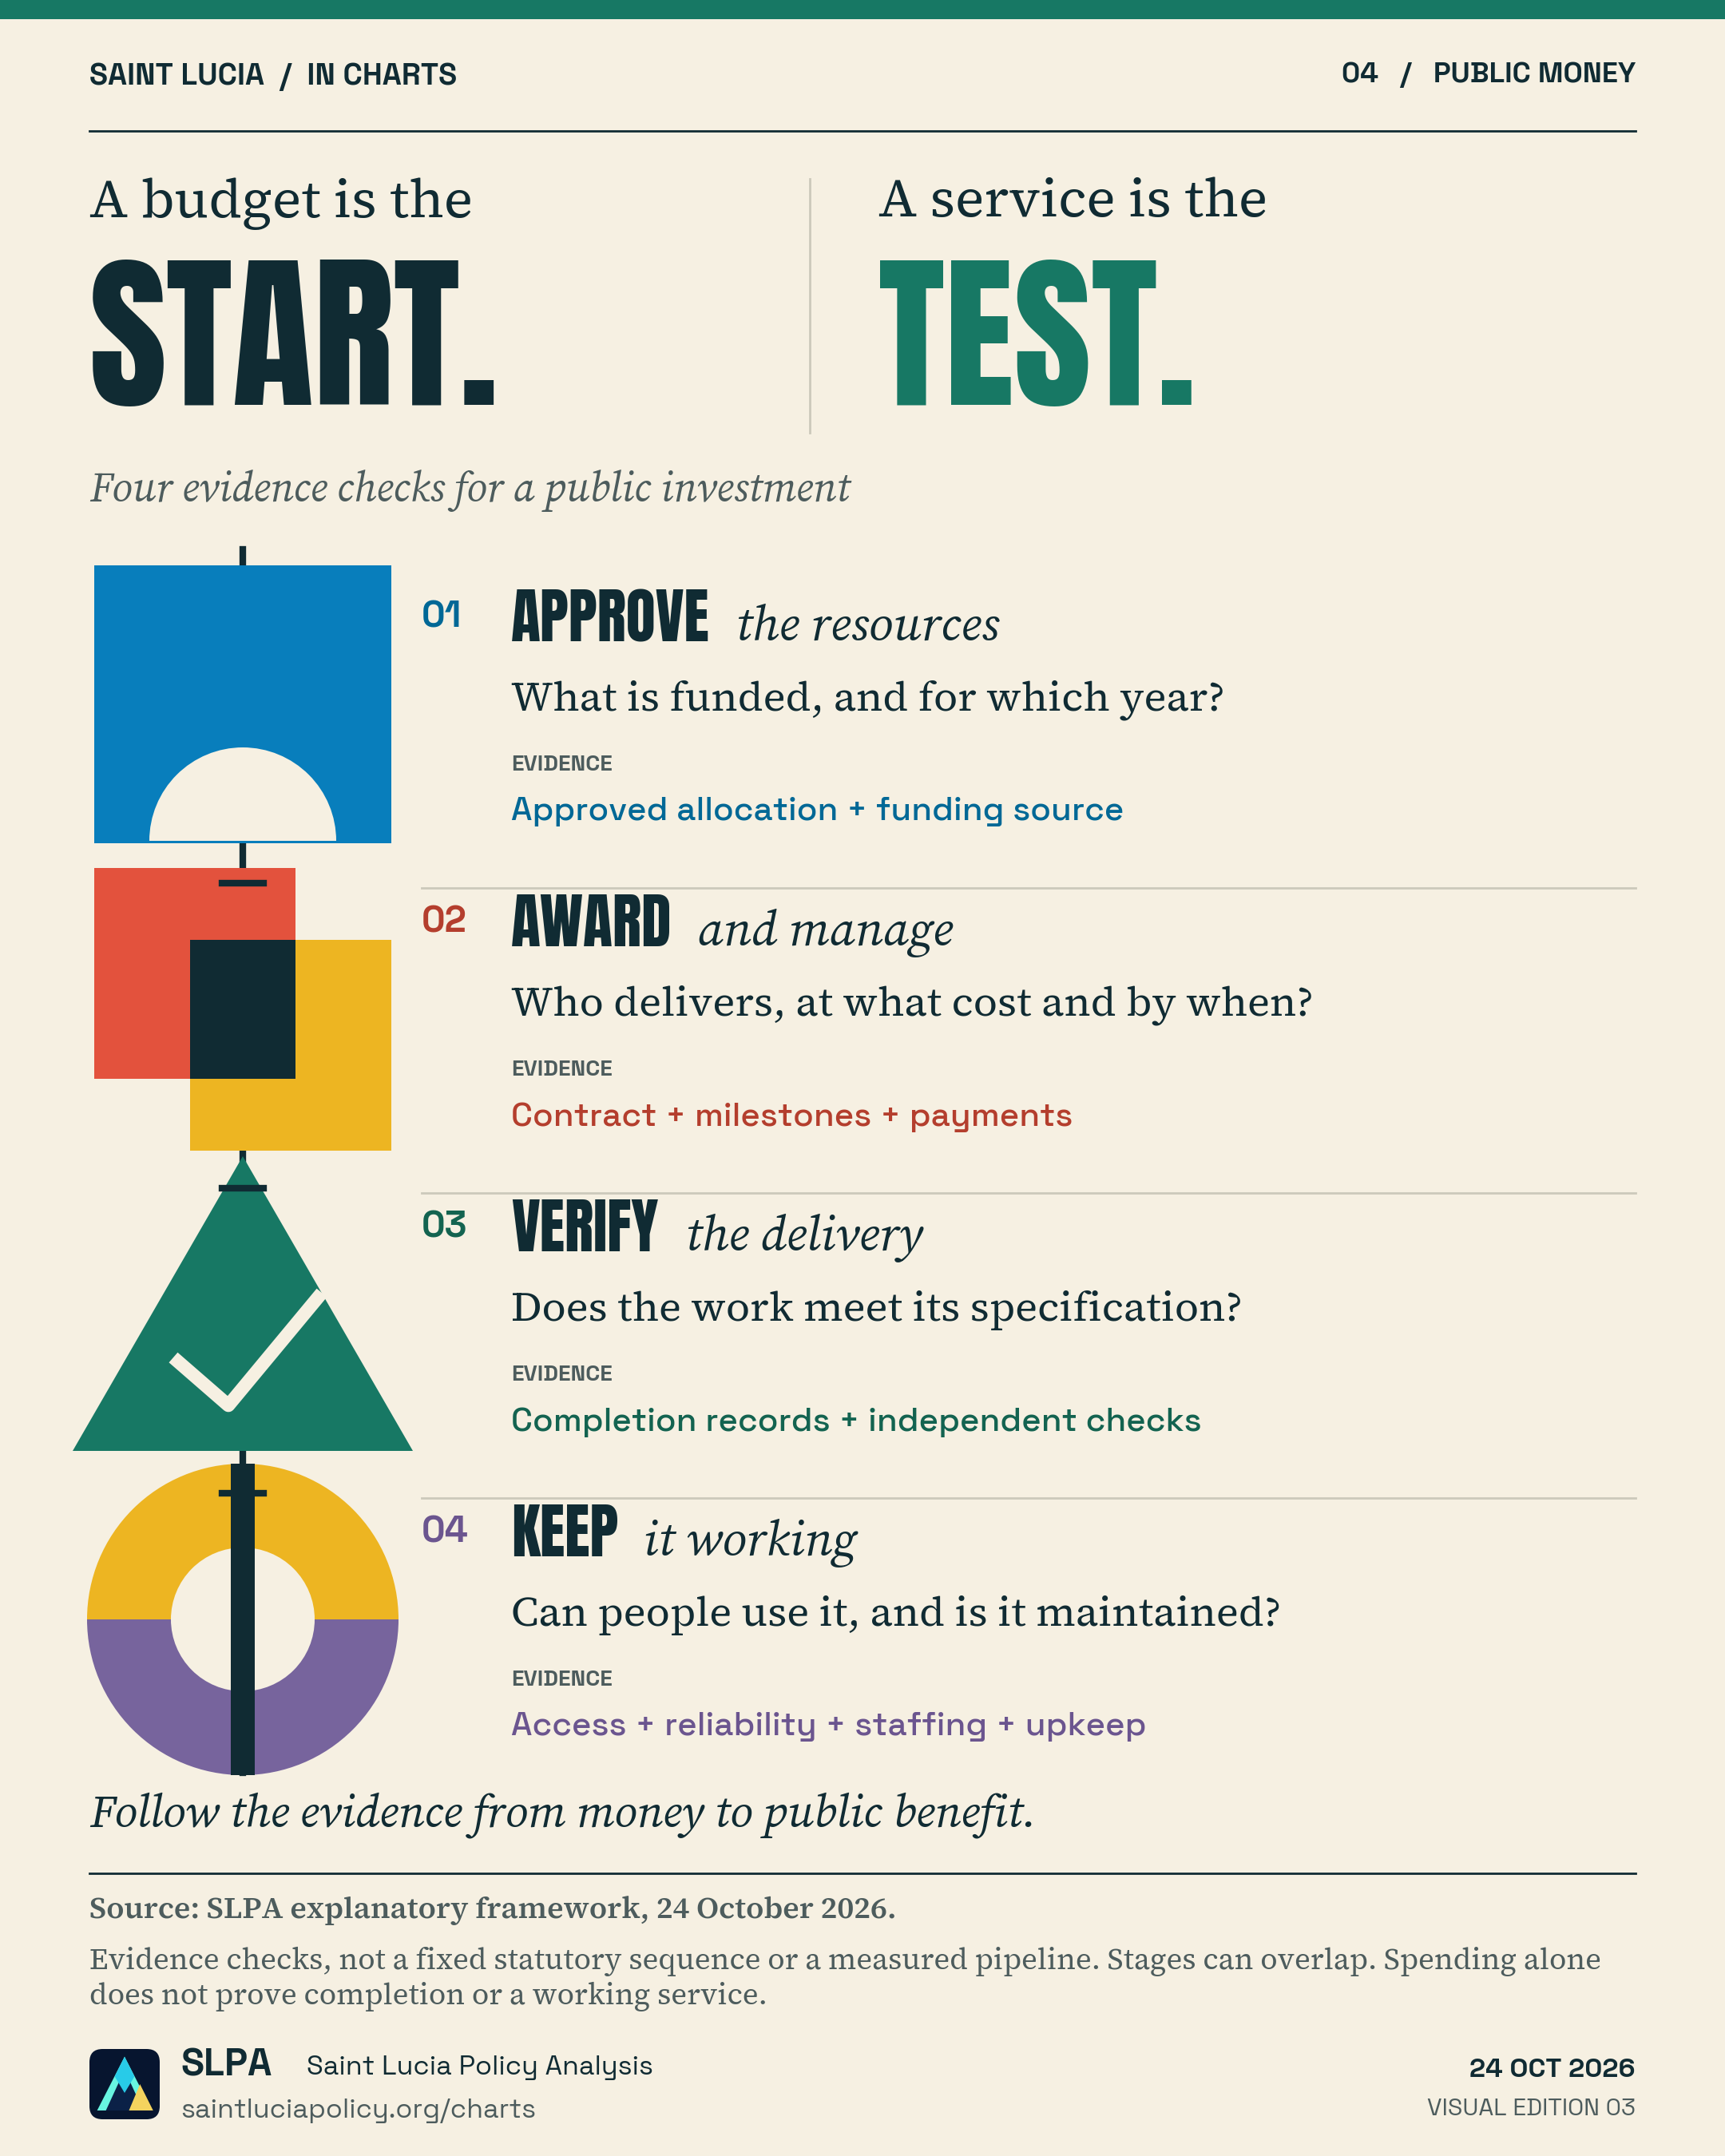
04 Public moneyProcess explainer
View graphic & sources ↗ Public-investment explainer
Follow a public investment from approved funding to a service people can use.
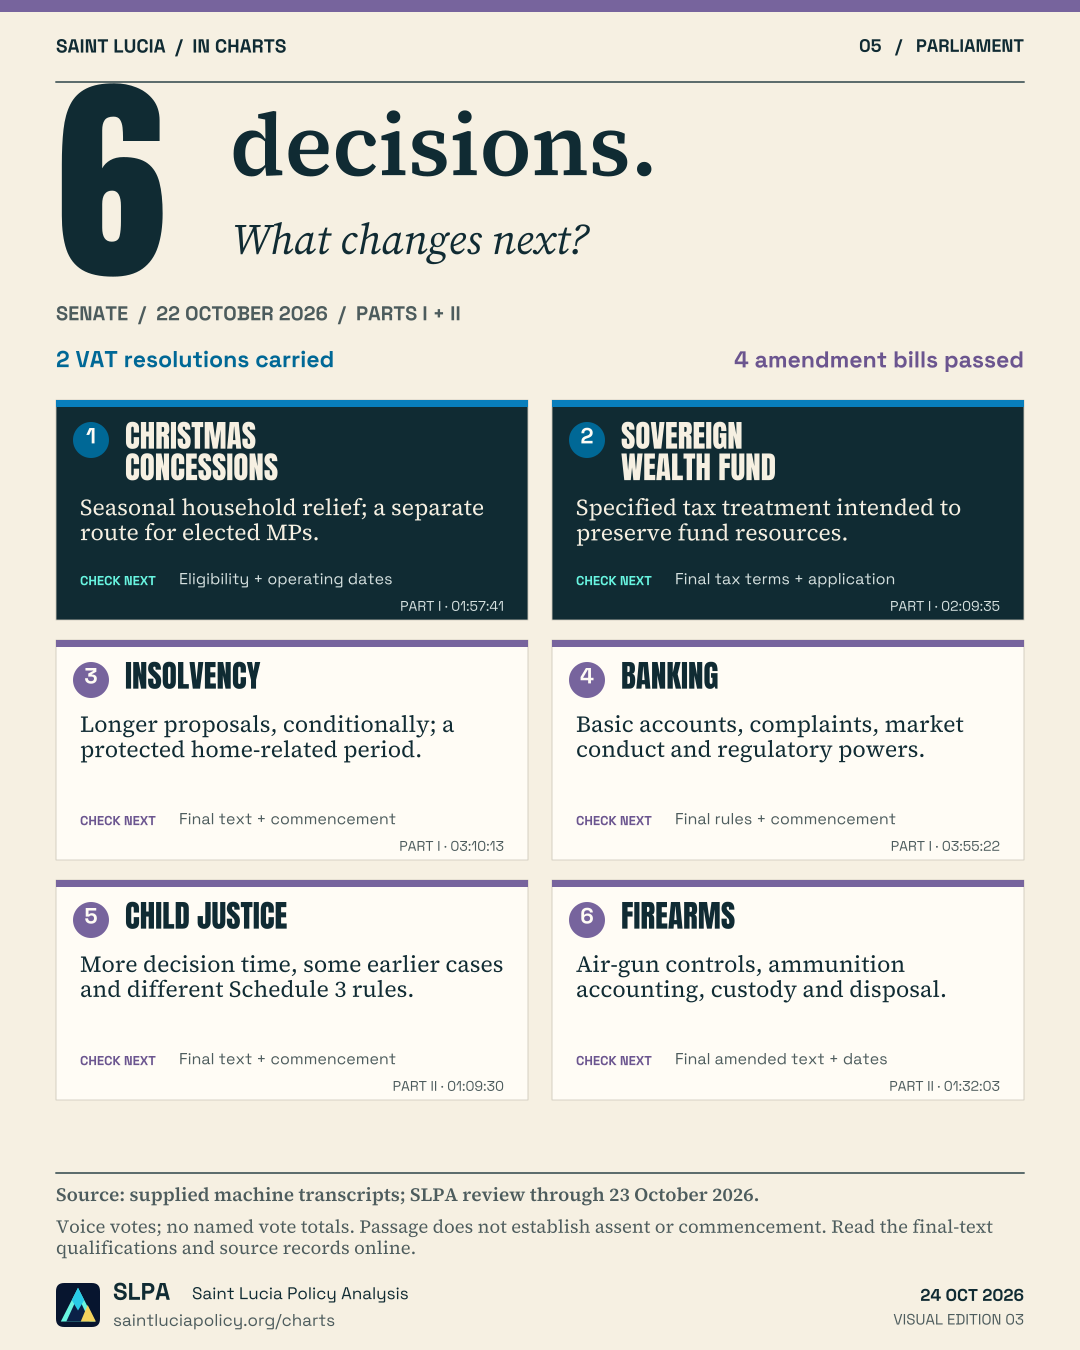
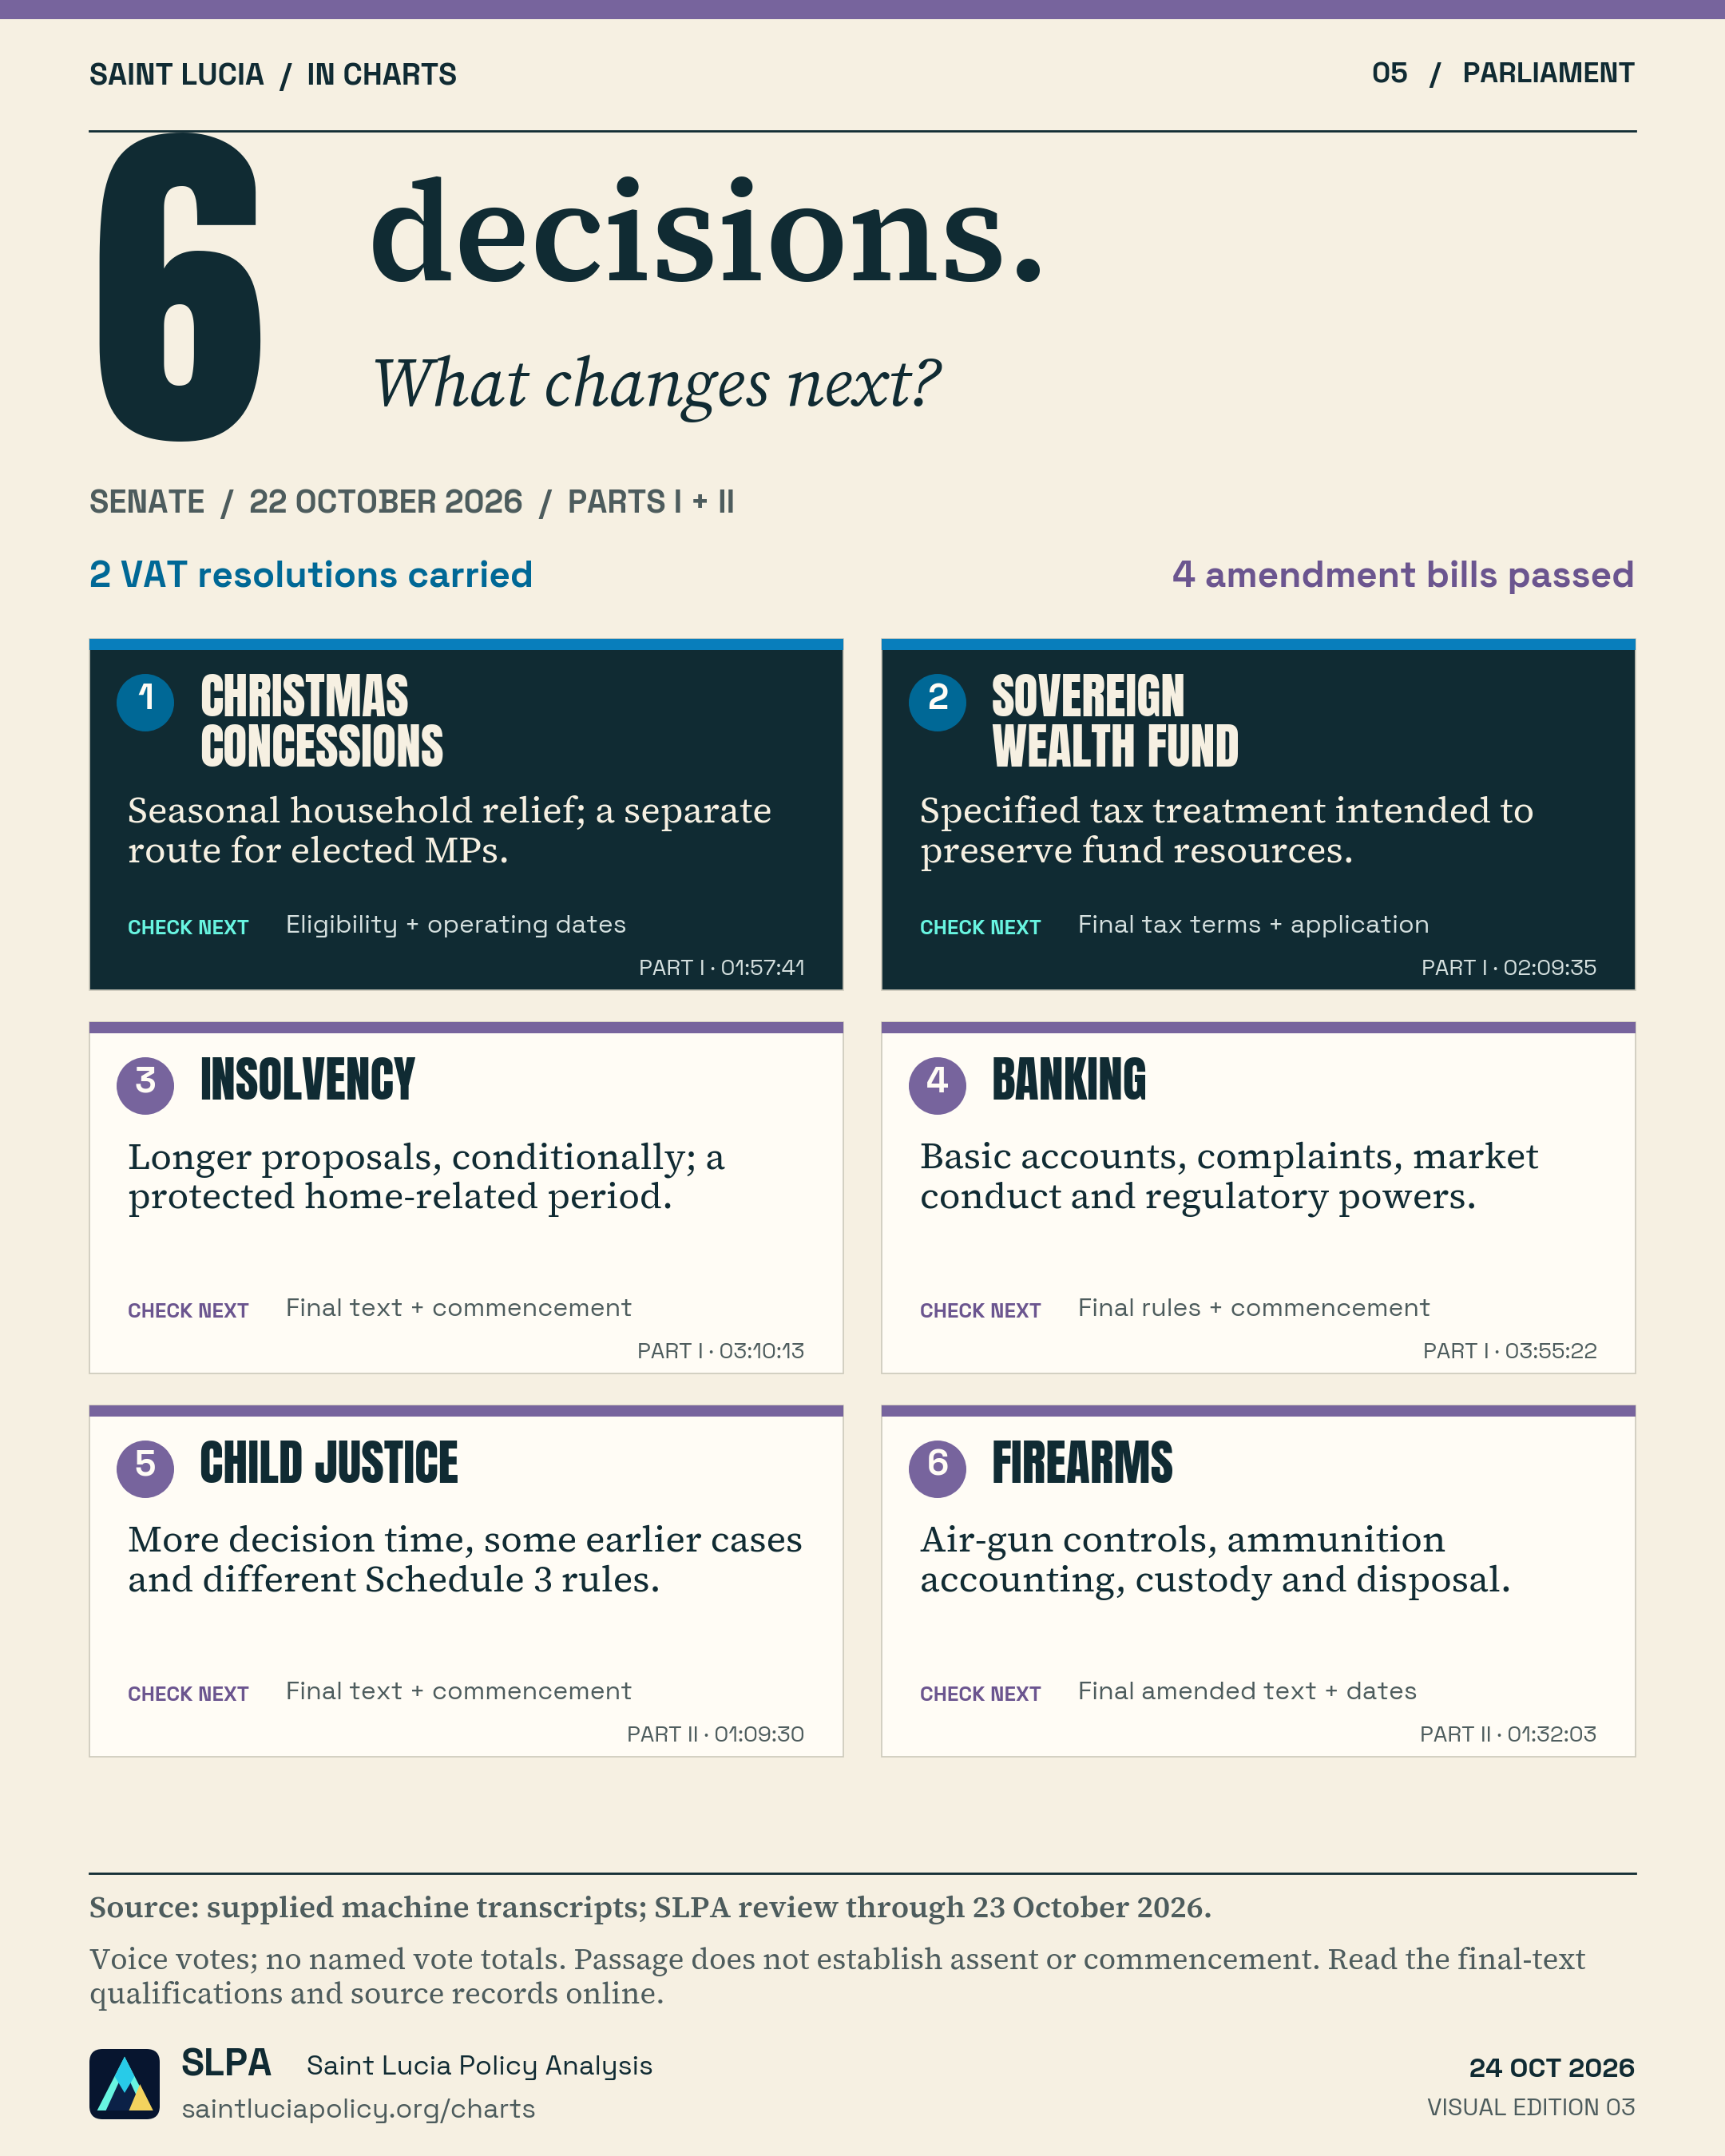
05 ParliamentDecision briefing
View graphic & sources ↗ 22 October 2026
The Senate’s 22 October sitting, condensed into one source-linked briefing.
Made to travel
The context stays Every graphic carries its subject, source and essential qualification, so it still makes sense when shared outside this site.
01 Save or print PNG images for sharing. A4 PDFs for reading, teaching and meetings. Vector SVGs for scaling cleanly. No sign-in required.
02 Check the evidence Open a visual for the underlying table, method, source links and full research. Numerical charts also include CSV data.
03 Keep the source attached When sharing, retain the source and qualification. Link to the visual’s page so readers can check its date and context.
 View graphic & sources