Public money / Data chart
For every EC$100 budgeted…
Compare approved plans with the recorded outturn for a completed financial year.
FY2024/25 · Published 24 October 2026
High-resolution PNG · A4 PDF · CSV data · Edition 03
Reading the visual
What to look for.
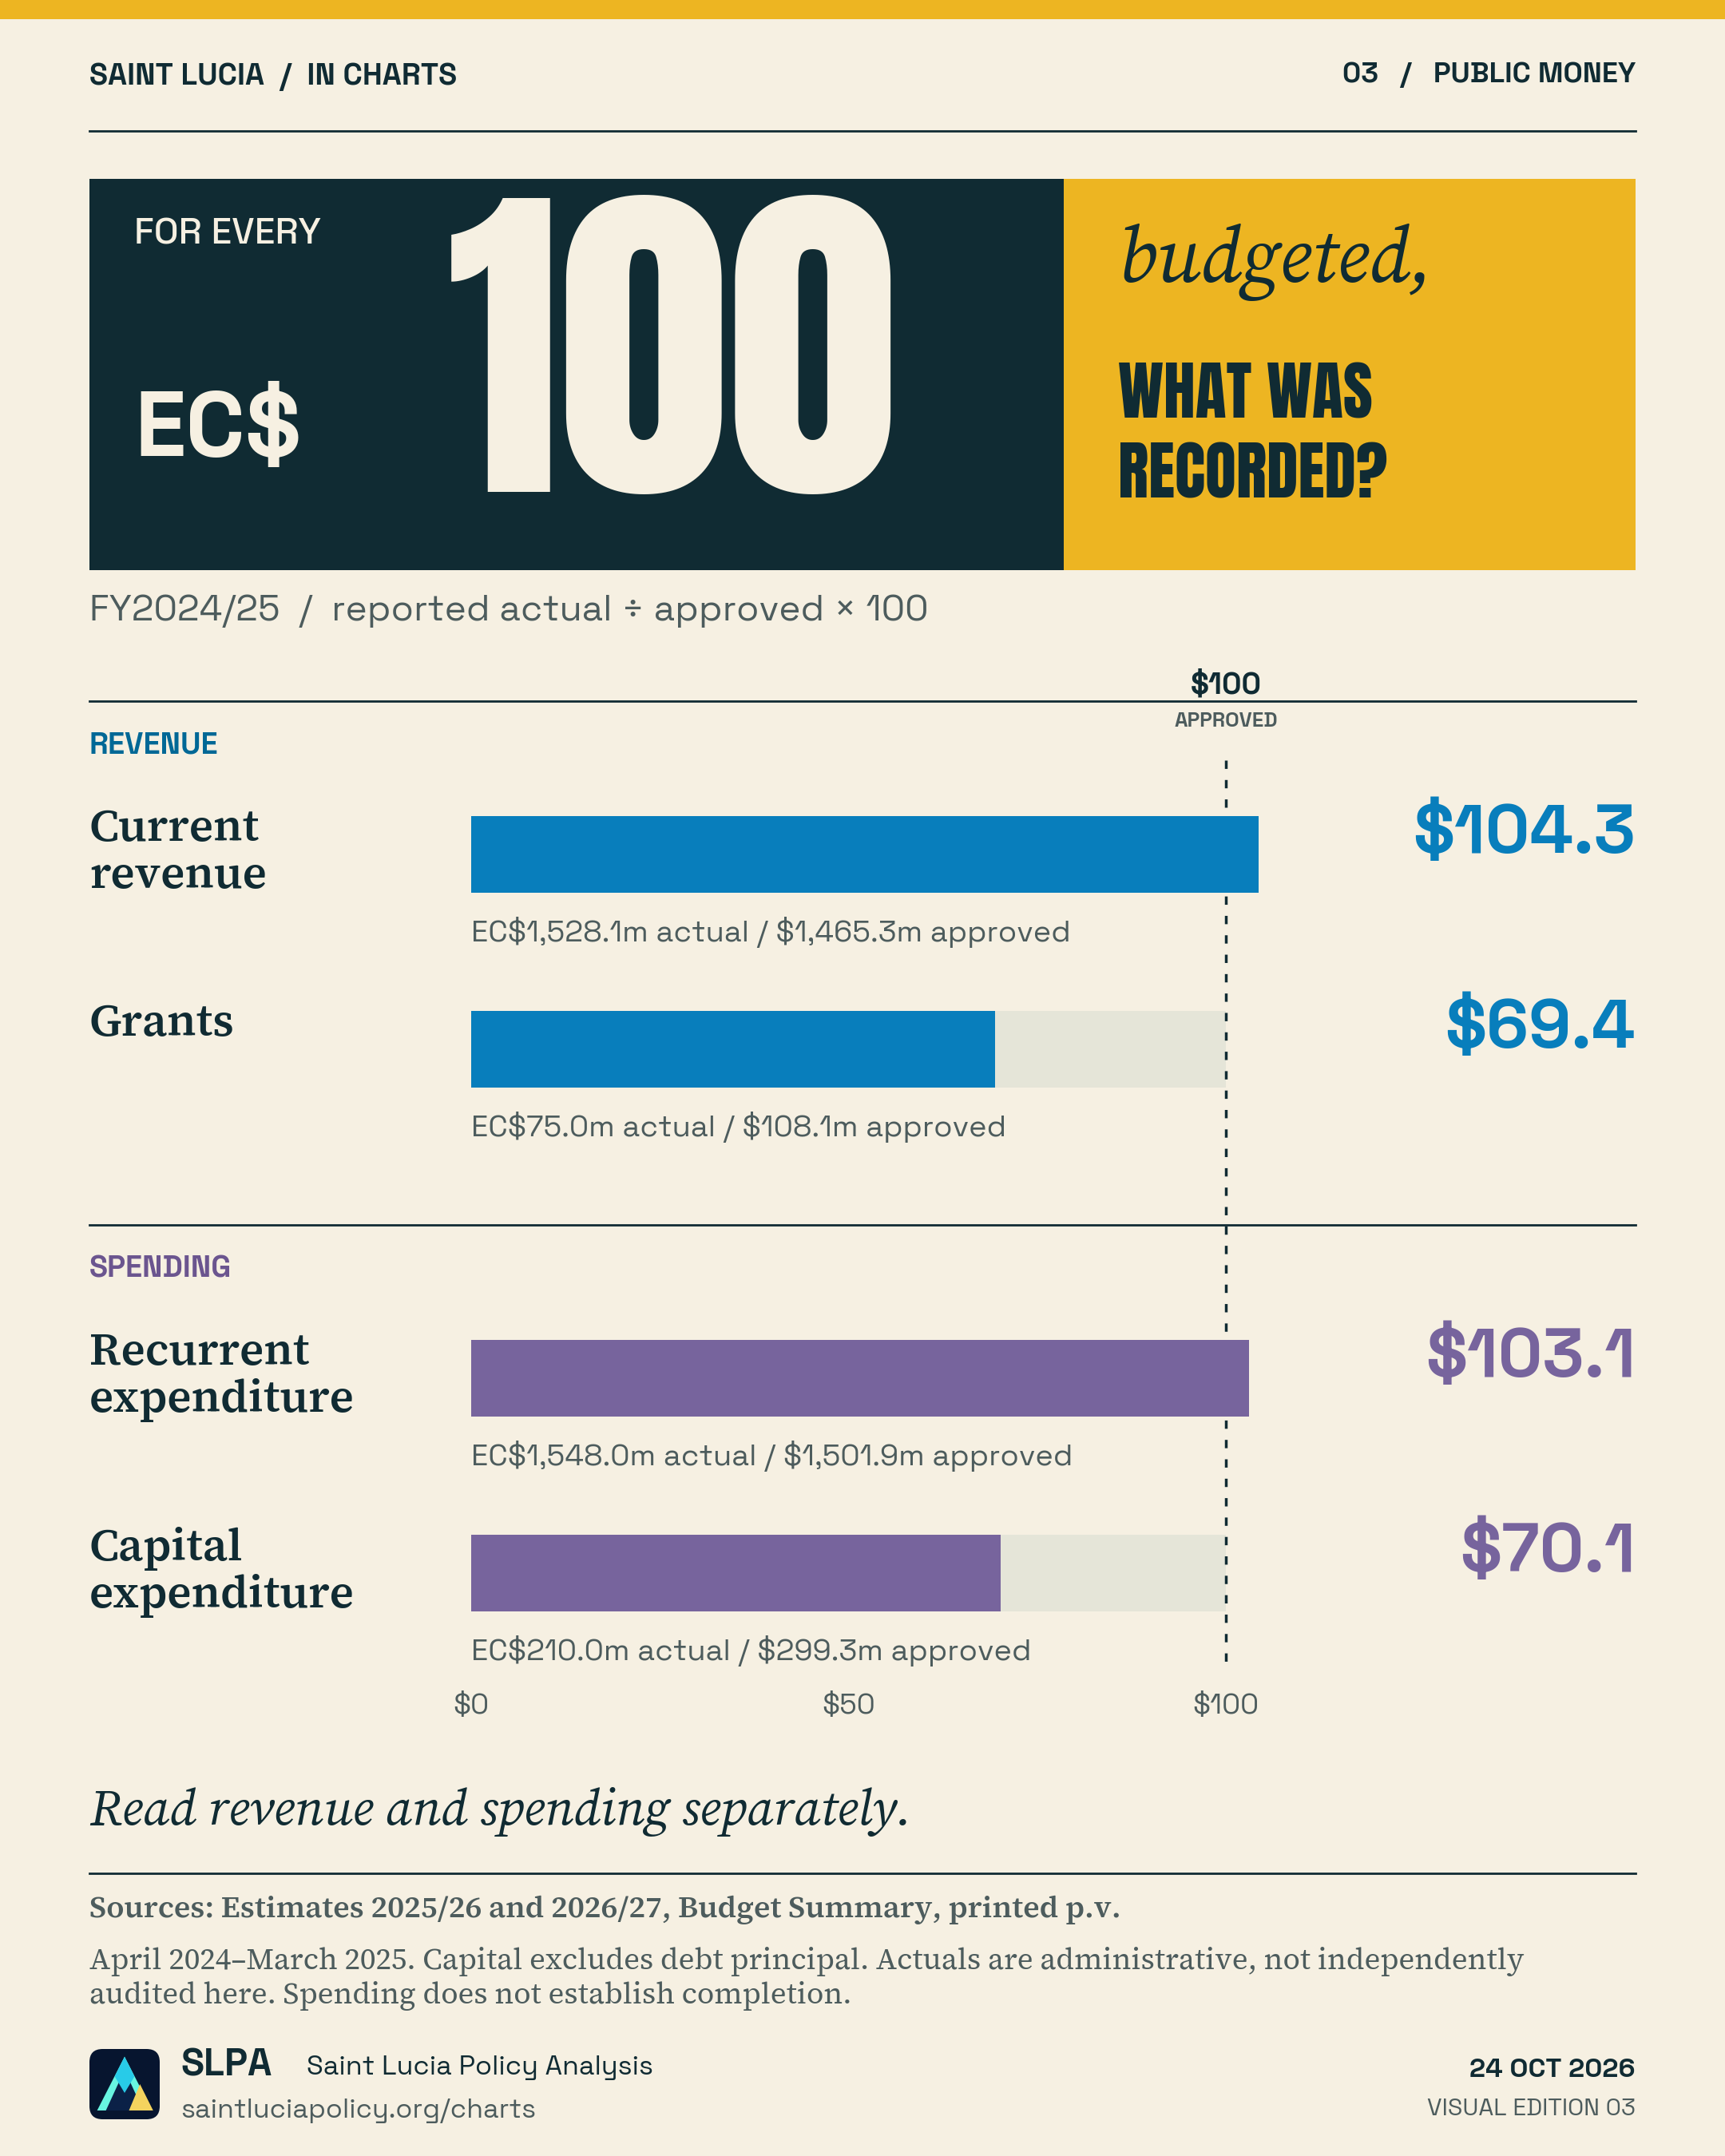
Each bar shows the recorded amount for every EC$100 in the original approved estimate. The reference line marks the approved budget. Read revenue and spending separately; these ratios should not be added together.
Revenue and expenditure are separate measures. Capital spending excludes debt principal. A lower spending ratio is not, by itself, a measure of waste, savings or completed projects.
Read the public-finance analysisFollow the evidence
Sources & method.
Approved amounts: Estimates 2025/26, Budget Summary, printed p. v. Reported actuals: Estimates 2026/27, Budget Summary, printed p. v. Both columns refer to FY2024/25.
| Category | Approved | Reported actual | Per EC$100 approved |
|---|---|---|---|
| Current revenue | 1,465,281,800 | 1,528,136,909 | 104.3 |
| Grants | 108,062,351 | 74,971,570 | 69.4 |
| Recurrent expenditure | 1,501,895,100 | 1,548,046,305 | 103.1 |
| Capital excluding debt principal | 299,314,900 | 209,953,151 | 70.1 |
Calculation: reported actual ÷ approved amount × 100. Recurrent expenditure is total GOSL recurrent expenditure, including project recurrent expenditure and refunds. Capital expenditure excludes debt principal. These are administrative actuals reported in later Estimates, not independently verified audited Public Accounts.