Tourism / Data chart
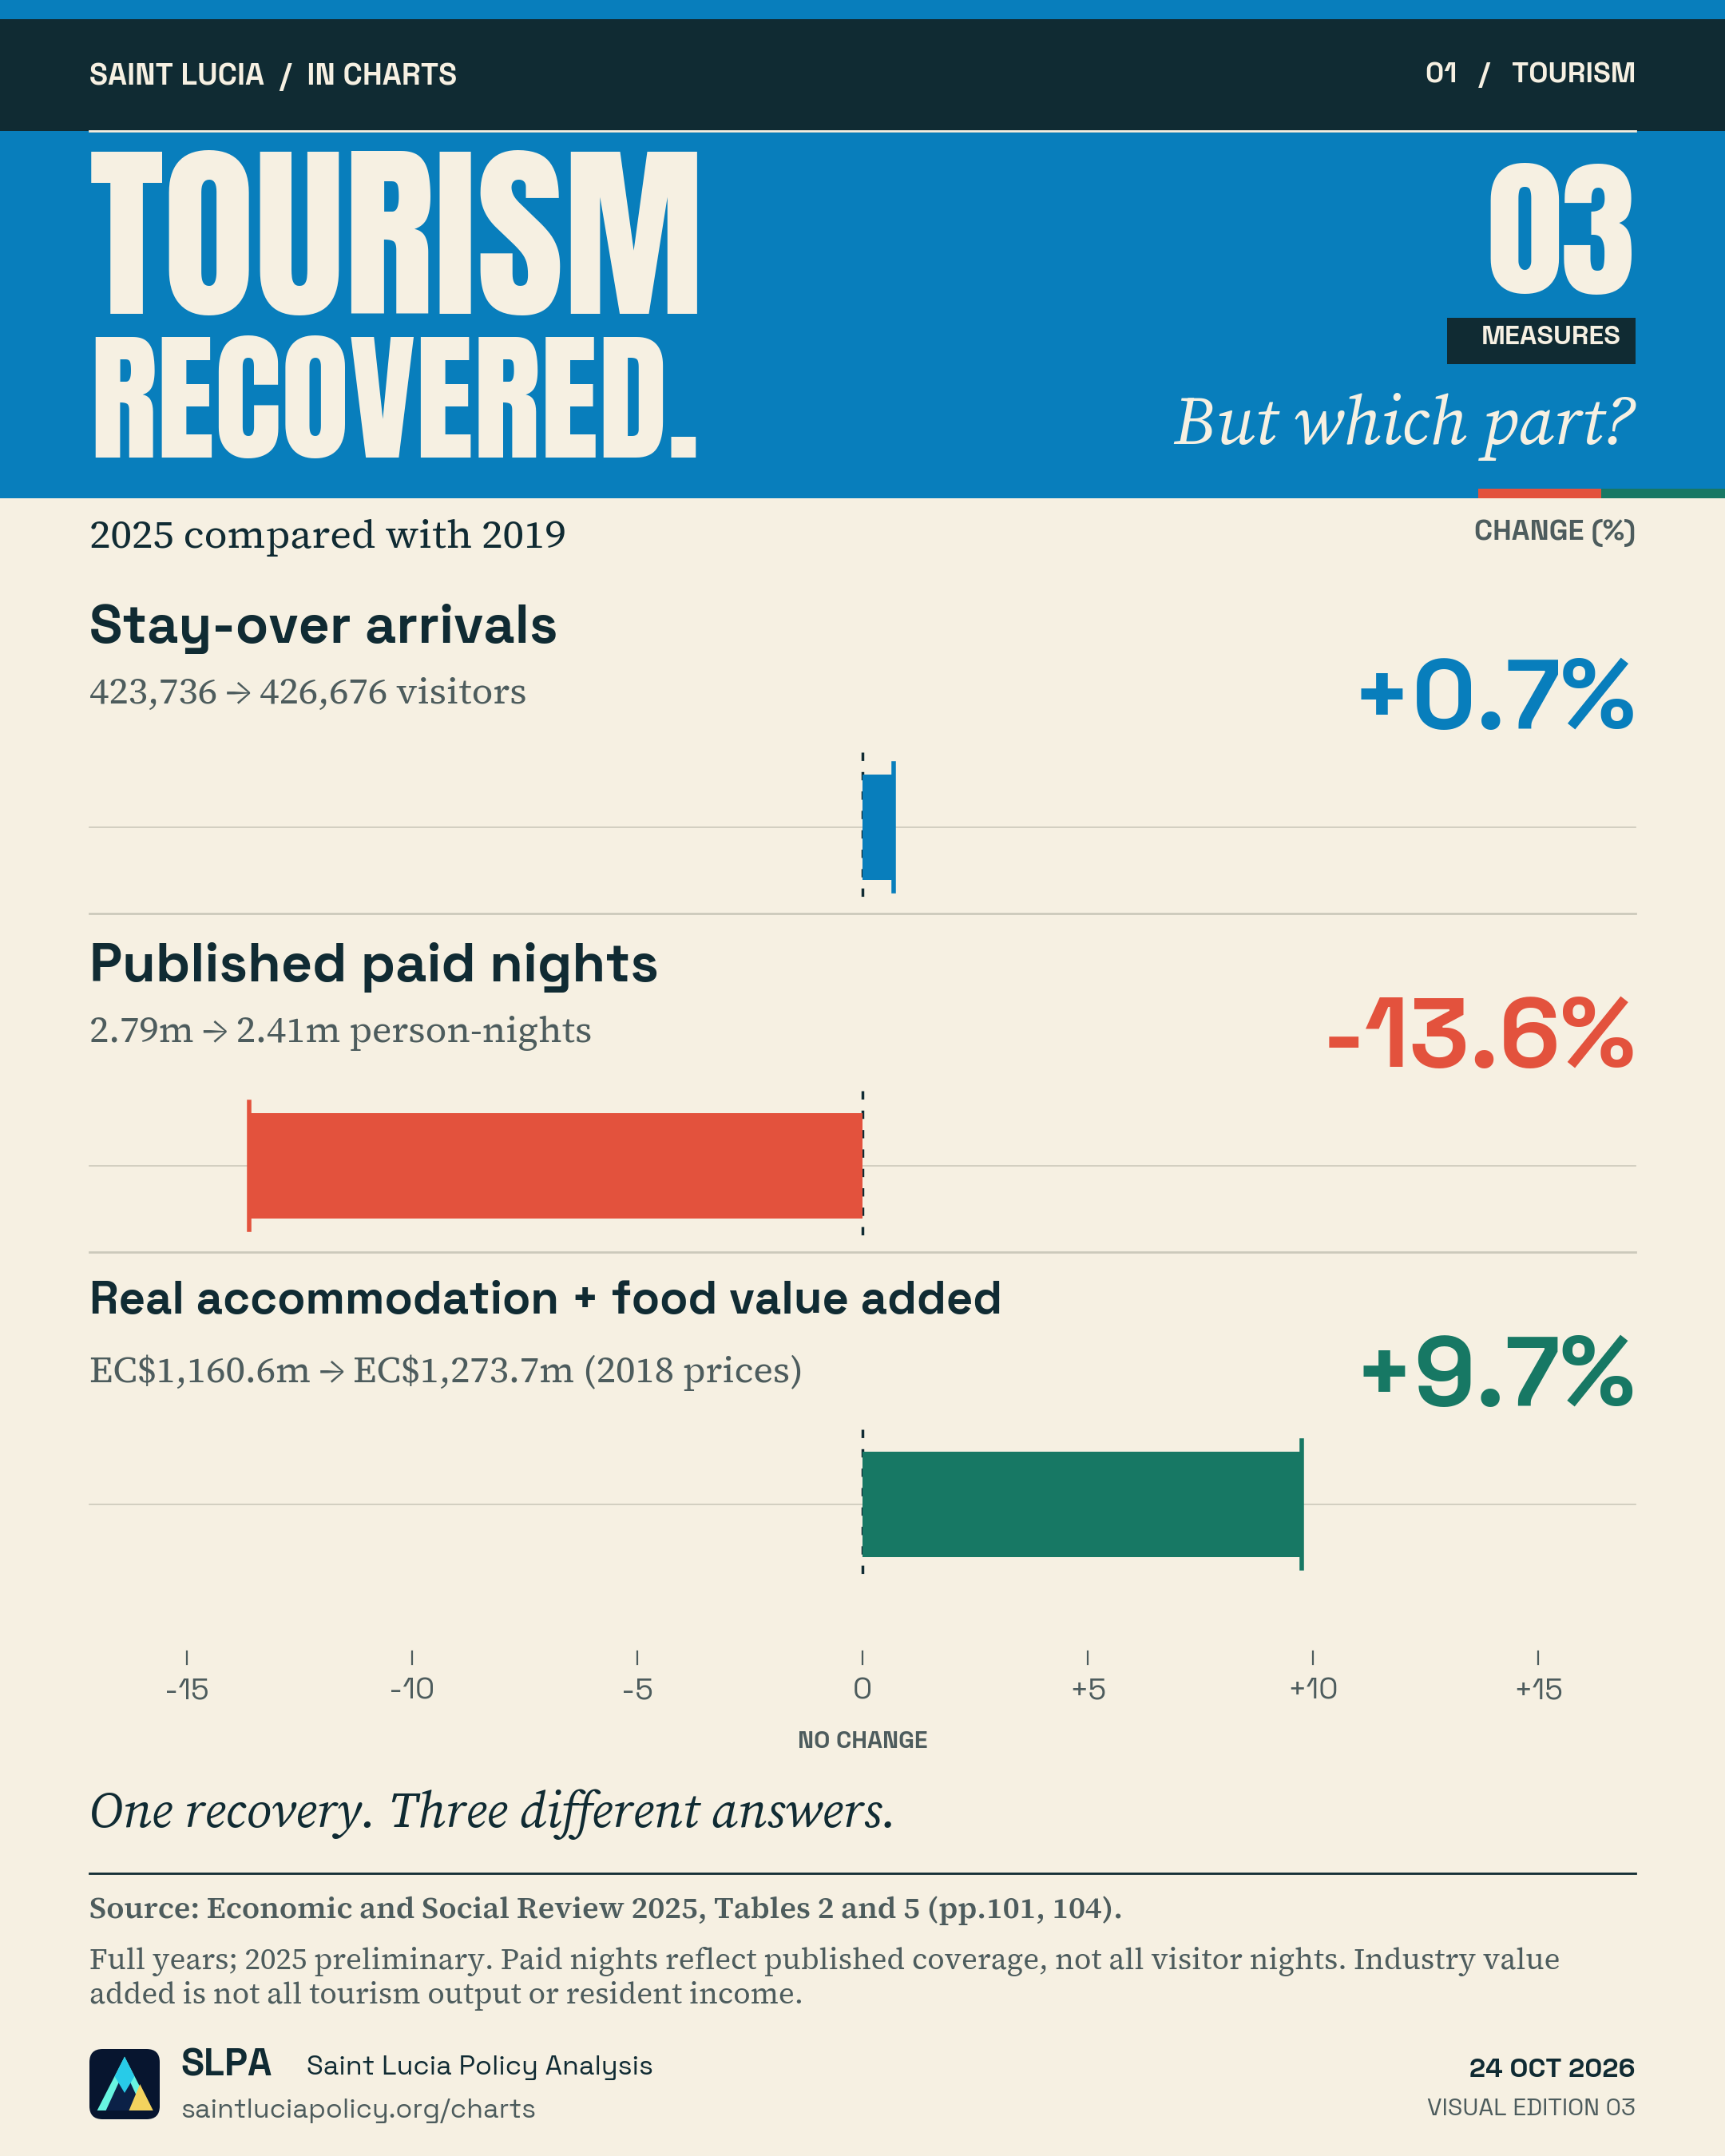
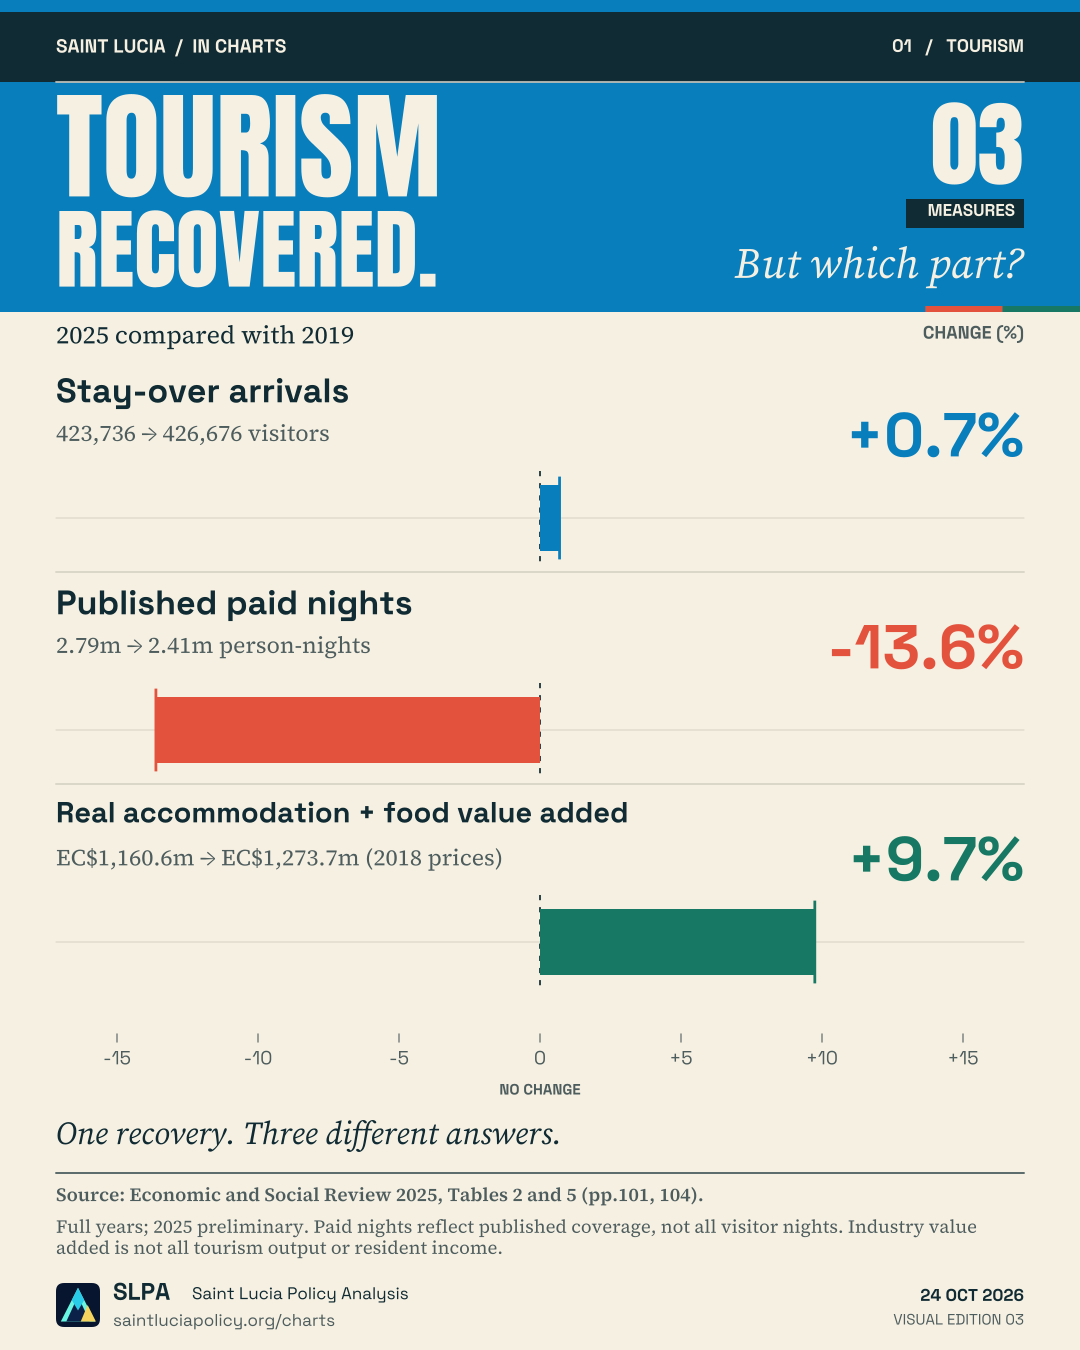
Tourism recovery depends on what we measure.
Visitors, paid nights and real production tell different parts of the recovery story.
2019 and 2025 · Published 24 October 2026
High-resolution PNG · A4 PDF · CSV data · Edition 03
Reading the visual
What to look for.
The bars share a zero line: no change from 2019. Right means an increase; left means a decrease. Their lengths show percentage changes on the same scale, allowing measures with different units to be compared.
Full calendar years. 2025 preliminary. Paid nights are rounded and reflect published coverage. Industry value added is not total tourism production or income reaching residents.
Read the tourism researchFollow the evidence
Sources & method.
Government of Saint Lucia, Economic and Social Review 2025, Appendix Table 2 (printed p.101) and Table 5 (printed p.104). Calculations by SLPA.
| Year | Stay-over arrivals | Paid nights (millions) | Real production (EC$m, 2018 prices) |
|---|---|---|---|
| 2019 | 423,736 | 2.79 | 1,160.6 |
| 2020 | 130,781 | 1.04 | 408.3 |
| 2021 | 199,347 | 1.60 | 640.9 |
| 2022 | 356,237 | 2.57 | 1,075.0 |
| 2023 | 380,791 | 2.44 | 1,209.8 |
| 2024 | 435,659 | 2.58 | 1,339.6 |
| 2025 | 426,676 | 2.41 | 1,273.7 |
Index = year’s value ÷ 2019 value × 100. Percentage change = index − 100. The source marks 2025 preliminary and earlier observations as revised where applicable. The CSV preserves source values and calculated indices.