Tourism / Data chart
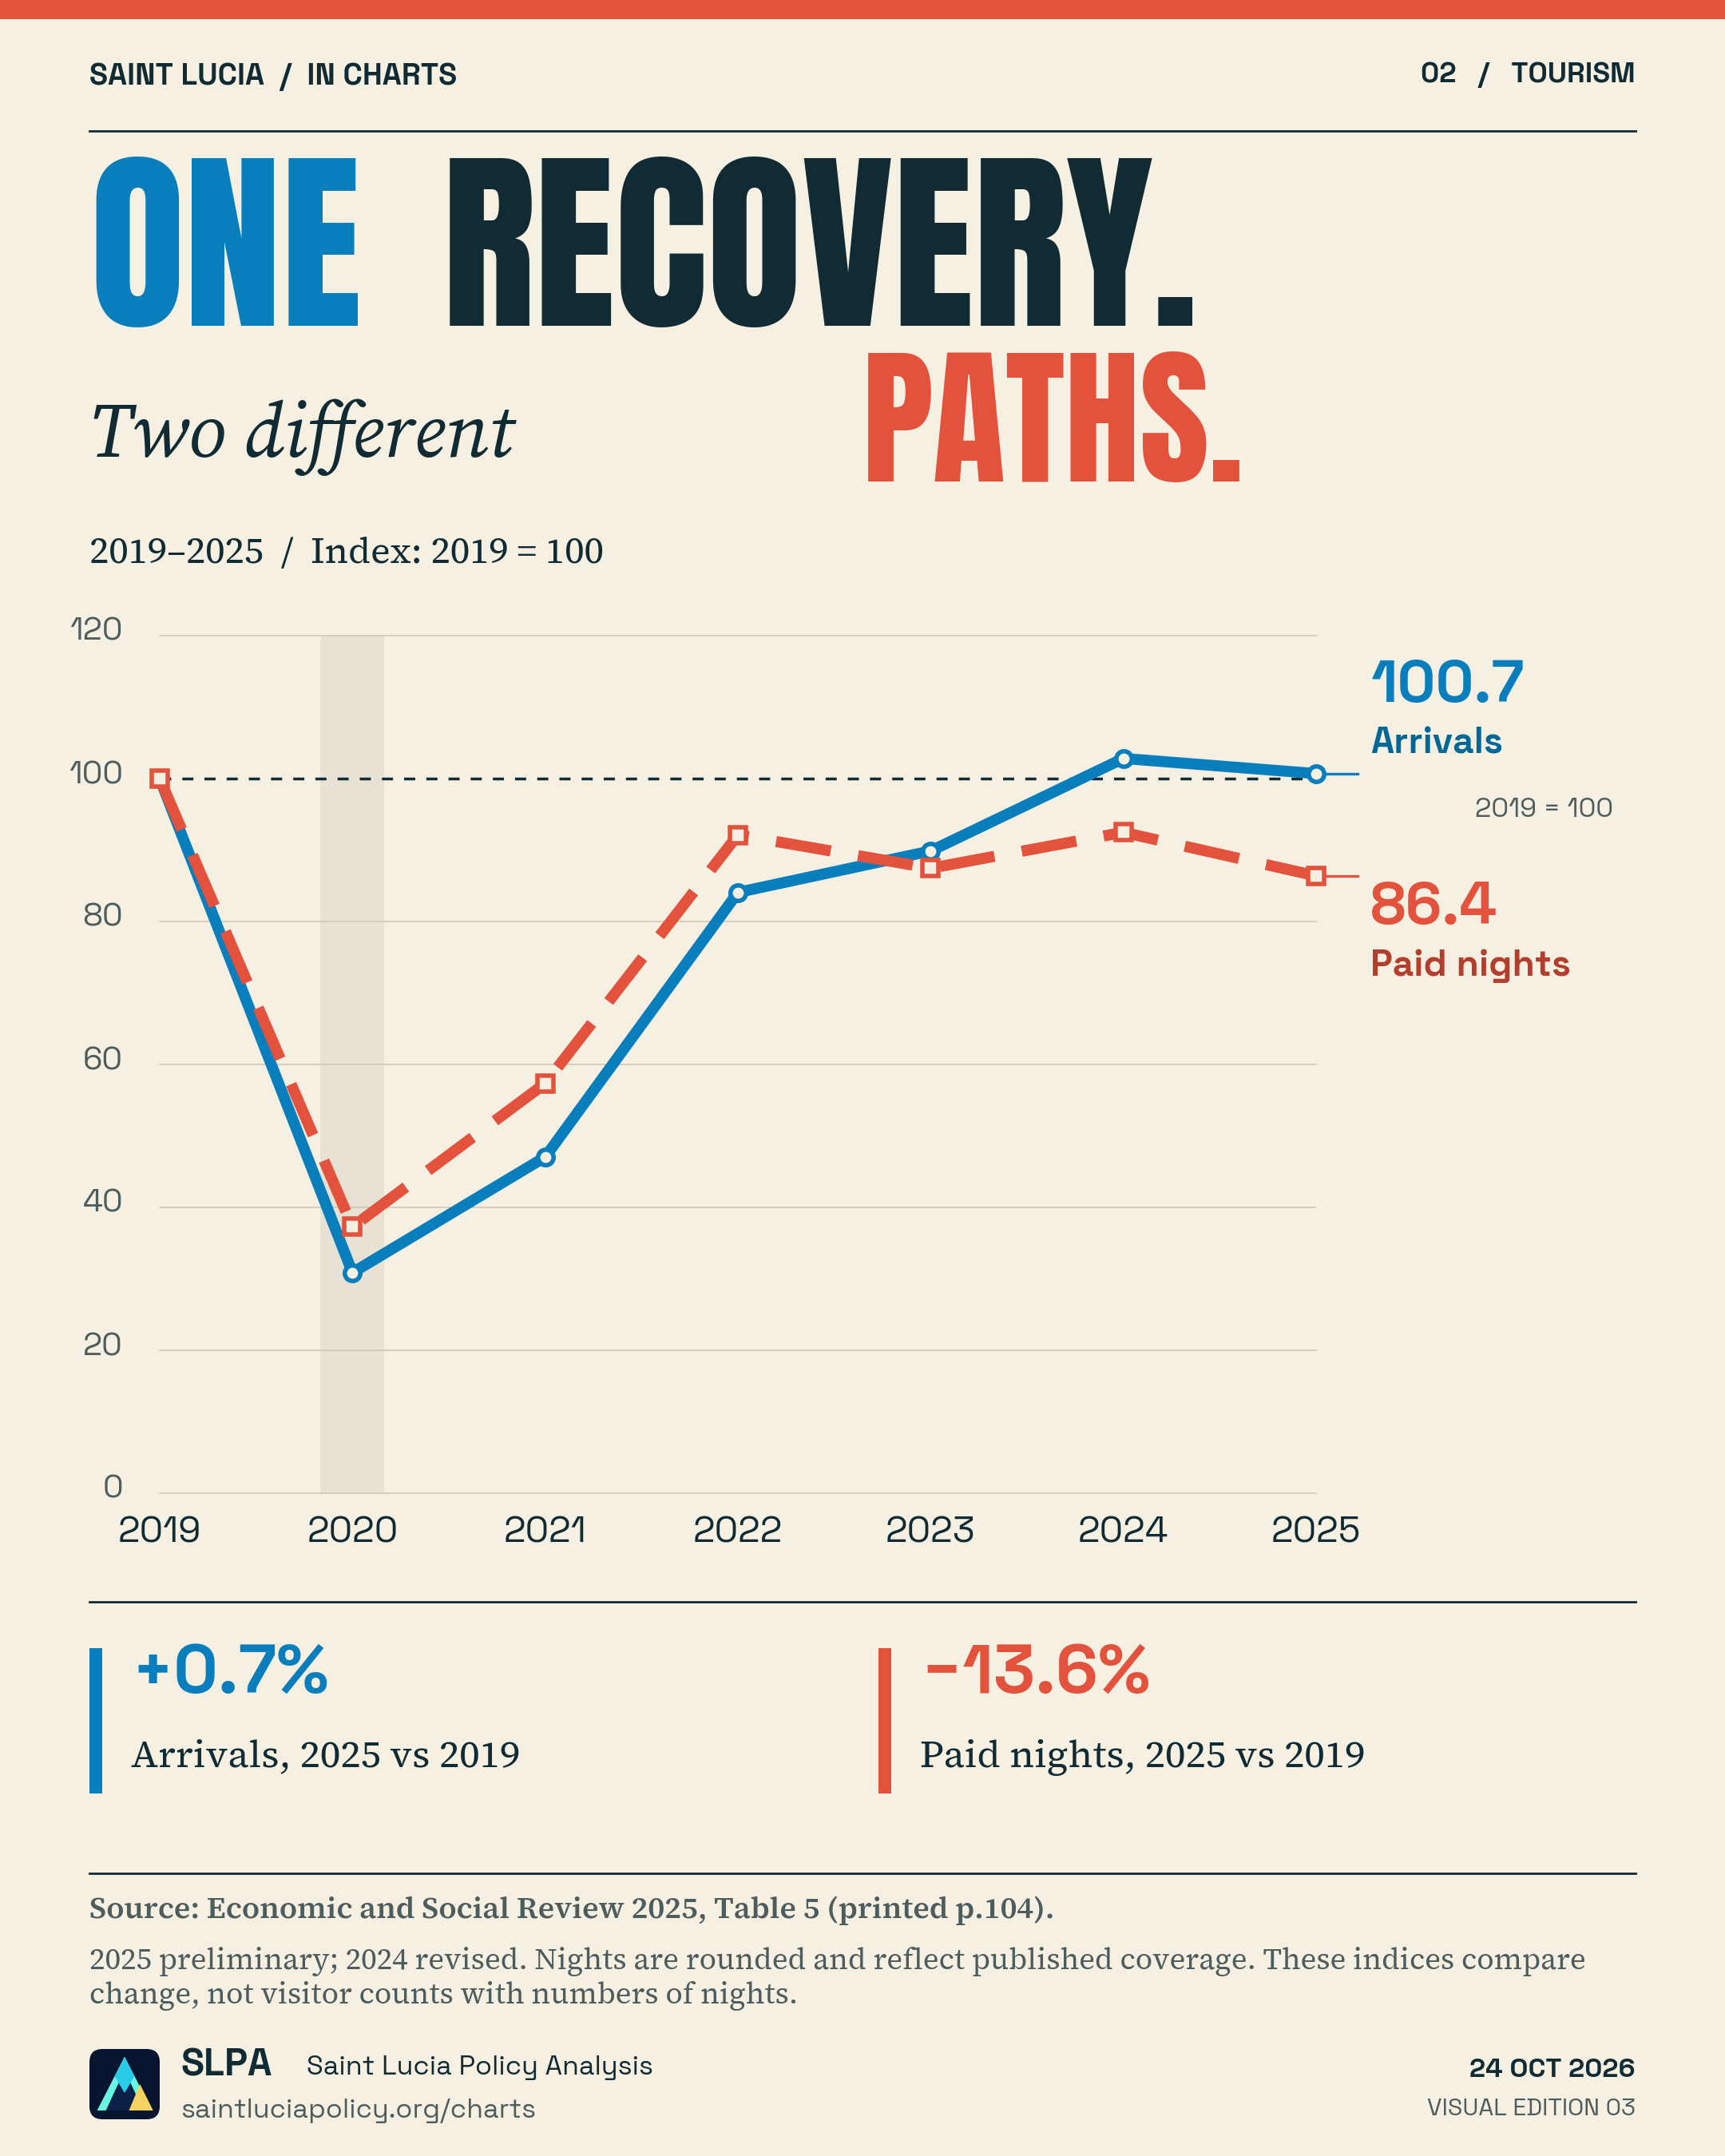
One recovery. Two different paths.
Follow arrivals and published paid nights through the pandemic and recovery.
2019–2025 · Published 24 October 2026
High-resolution PNG · A4 PDF · CSV data · Edition 03
Explore the record
Seven years. Two paths.
Move through the years. Both series use 2019 = 100.
Source: Economic and Social Review 2025, Appendix Table 5. Paid nights are rounded and reflect published accommodation coverage. They are not all visitor nights. See the data and method ↓
Reading the visual
What to look for.
The lines use a common starting point: 2019 equals 100. This compares changes over time, not the absolute number of visitors with the number of nights.
Annual figures from one publication vintage. Nights are rounded and reflect published accommodation coverage; they do not measure every visitor night. 2025 is preliminary.
Explore the recovery recordFollow the evidence
Sources & method.
Government of Saint Lucia, Economic and Social Review 2025, Appendix Table 2 (printed p.101) and Table 5 (printed p.104). Calculations by SLPA.
| Year | Stay-over arrivals | Paid nights (millions) | Real production (EC$m, 2018 prices) |
|---|---|---|---|
| 2019 | 423,736 | 2.79 | 1,160.6 |
| 2020 | 130,781 | 1.04 | 408.3 |
| 2021 | 199,347 | 1.60 | 640.9 |
| 2022 | 356,237 | 2.57 | 1,075.0 |
| 2023 | 380,791 | 2.44 | 1,209.8 |
| 2024 | 435,659 | 2.58 | 1,339.6 |
| 2025 | 426,676 | 2.41 | 1,273.7 |
Index = year’s value ÷ 2019 value × 100. Percentage change = index − 100. The source marks 2025 preliminary and earlier observations as revised where applicable. The CSV preserves source values and calculated indices.