Households / Data chart
Water tanks, household by household.
Compare households reporting a water tank in use across Saint Lucia’s 12 census districts.
2022 census · Published 24 October 2026
High-resolution PNG · A4 PDF · CSV data · Edition 04
Reading the visual
What to look for.
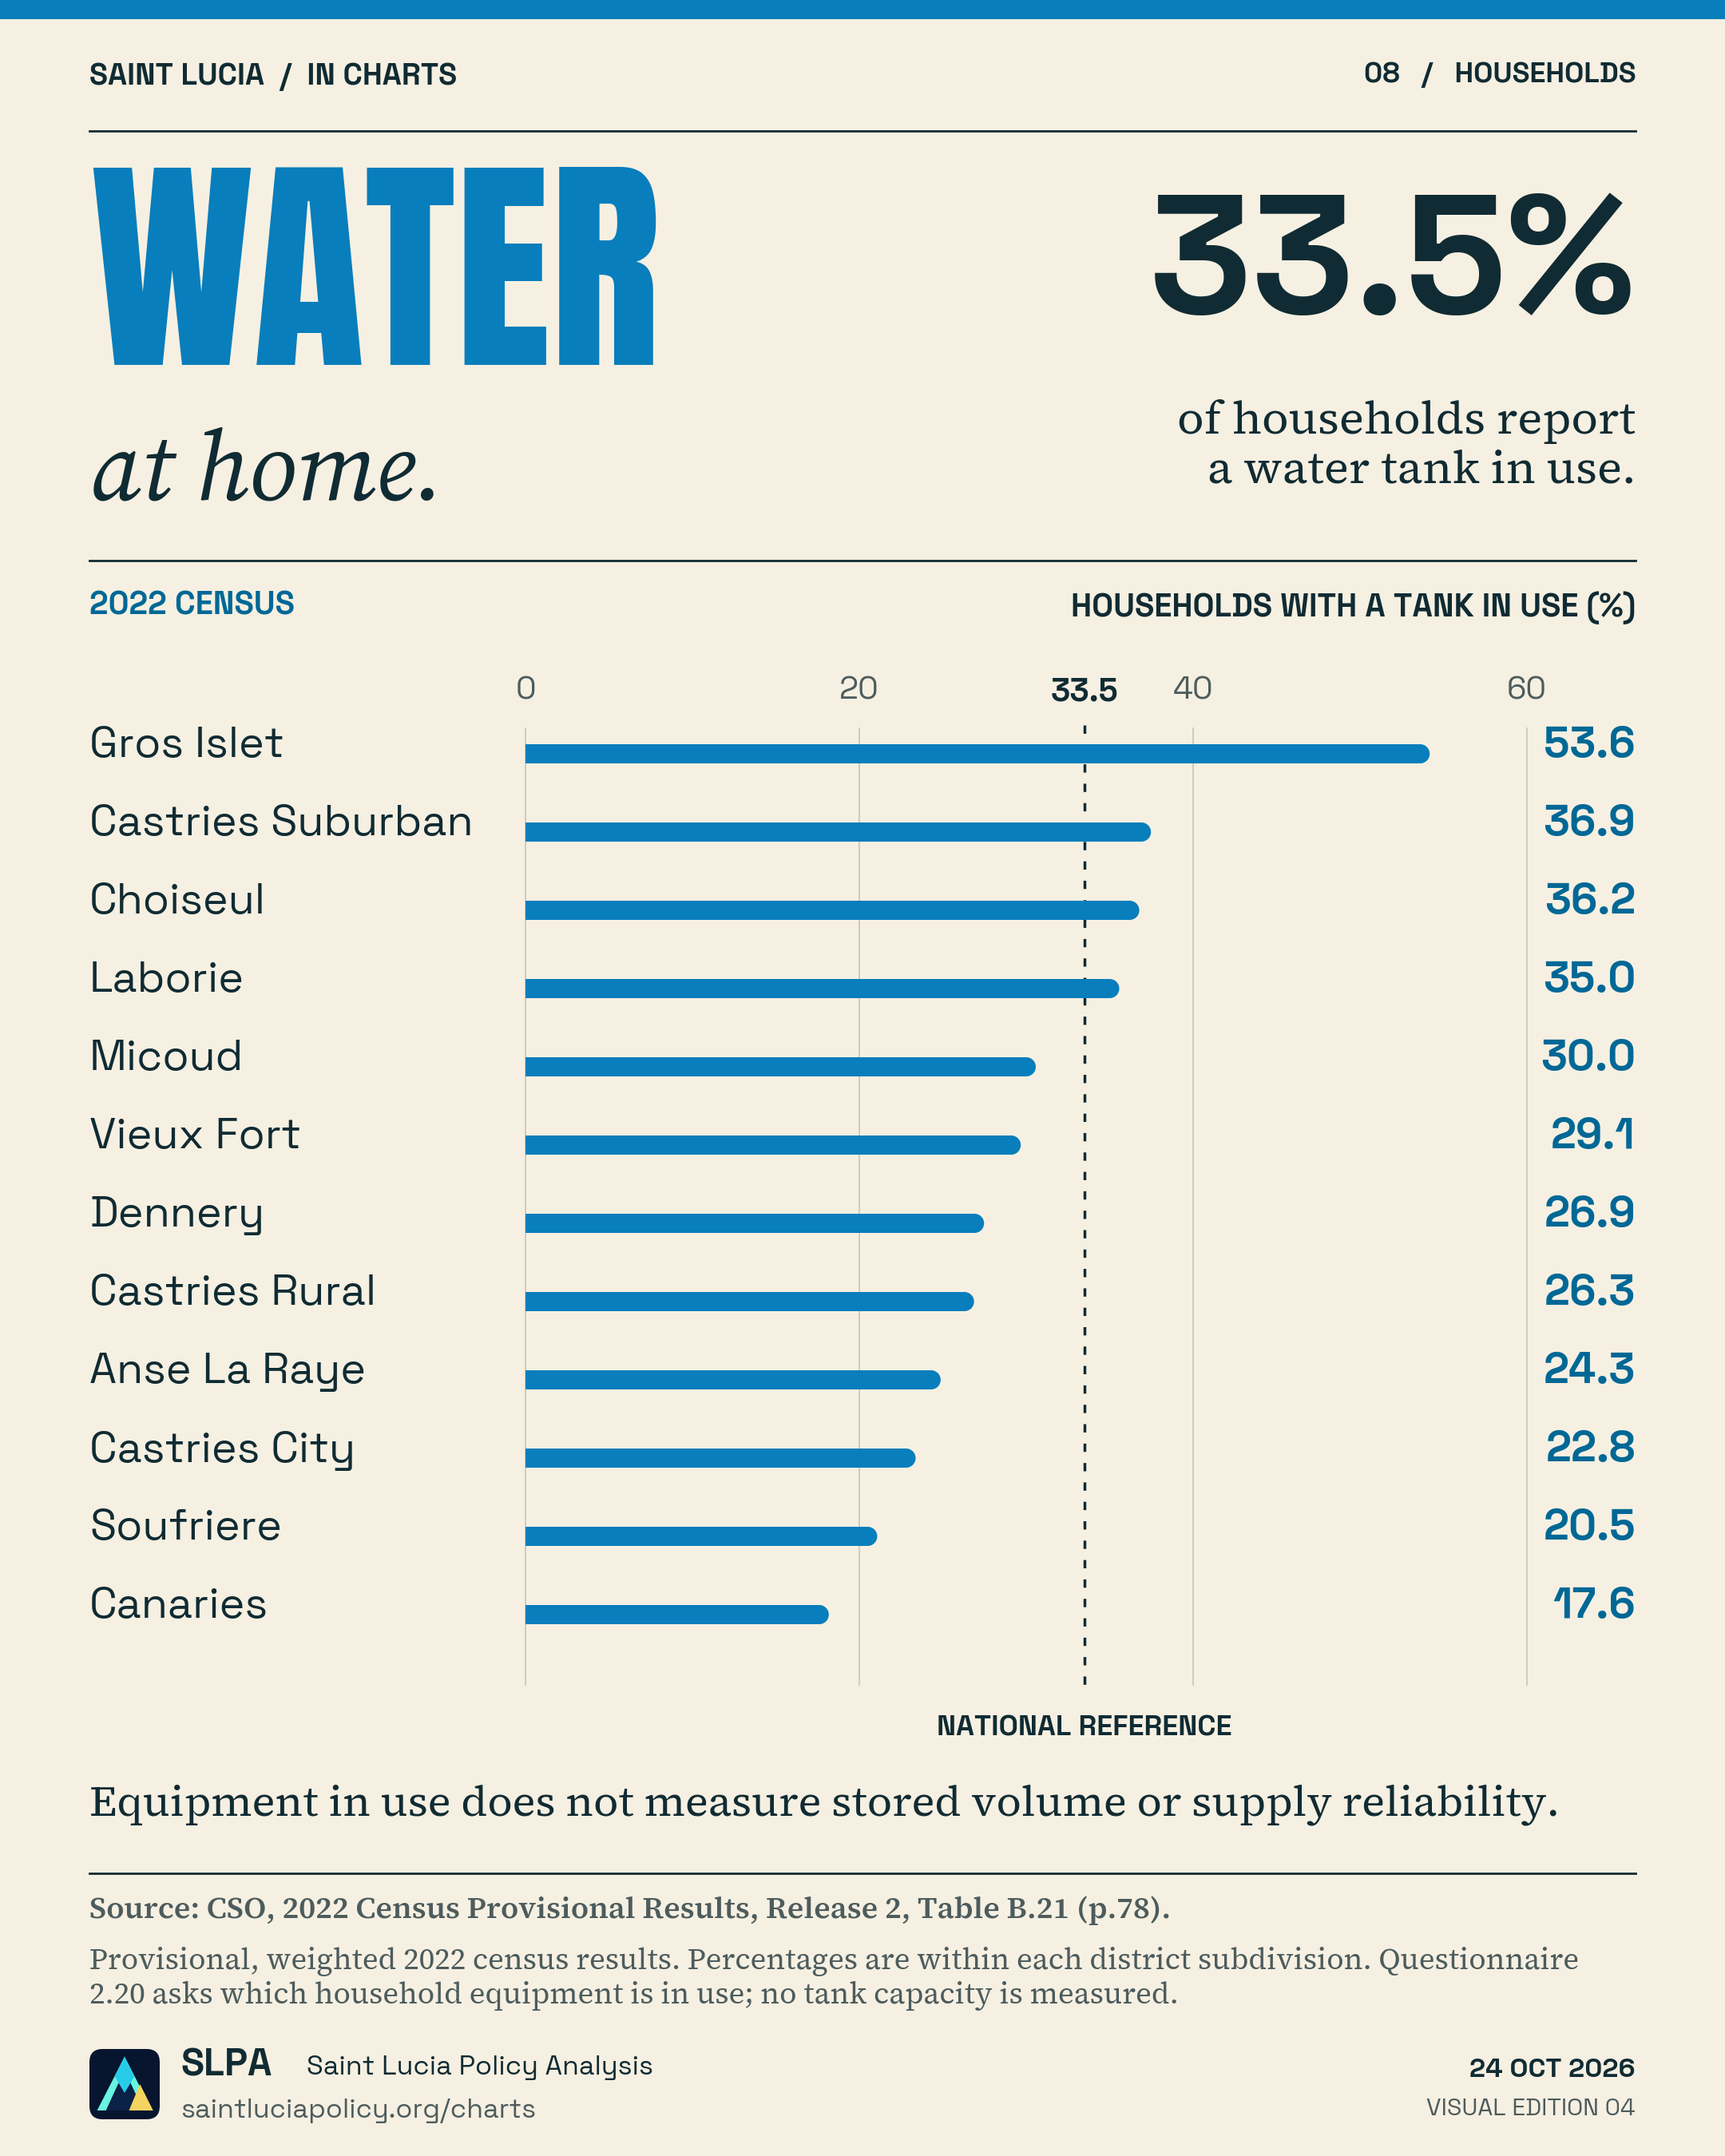
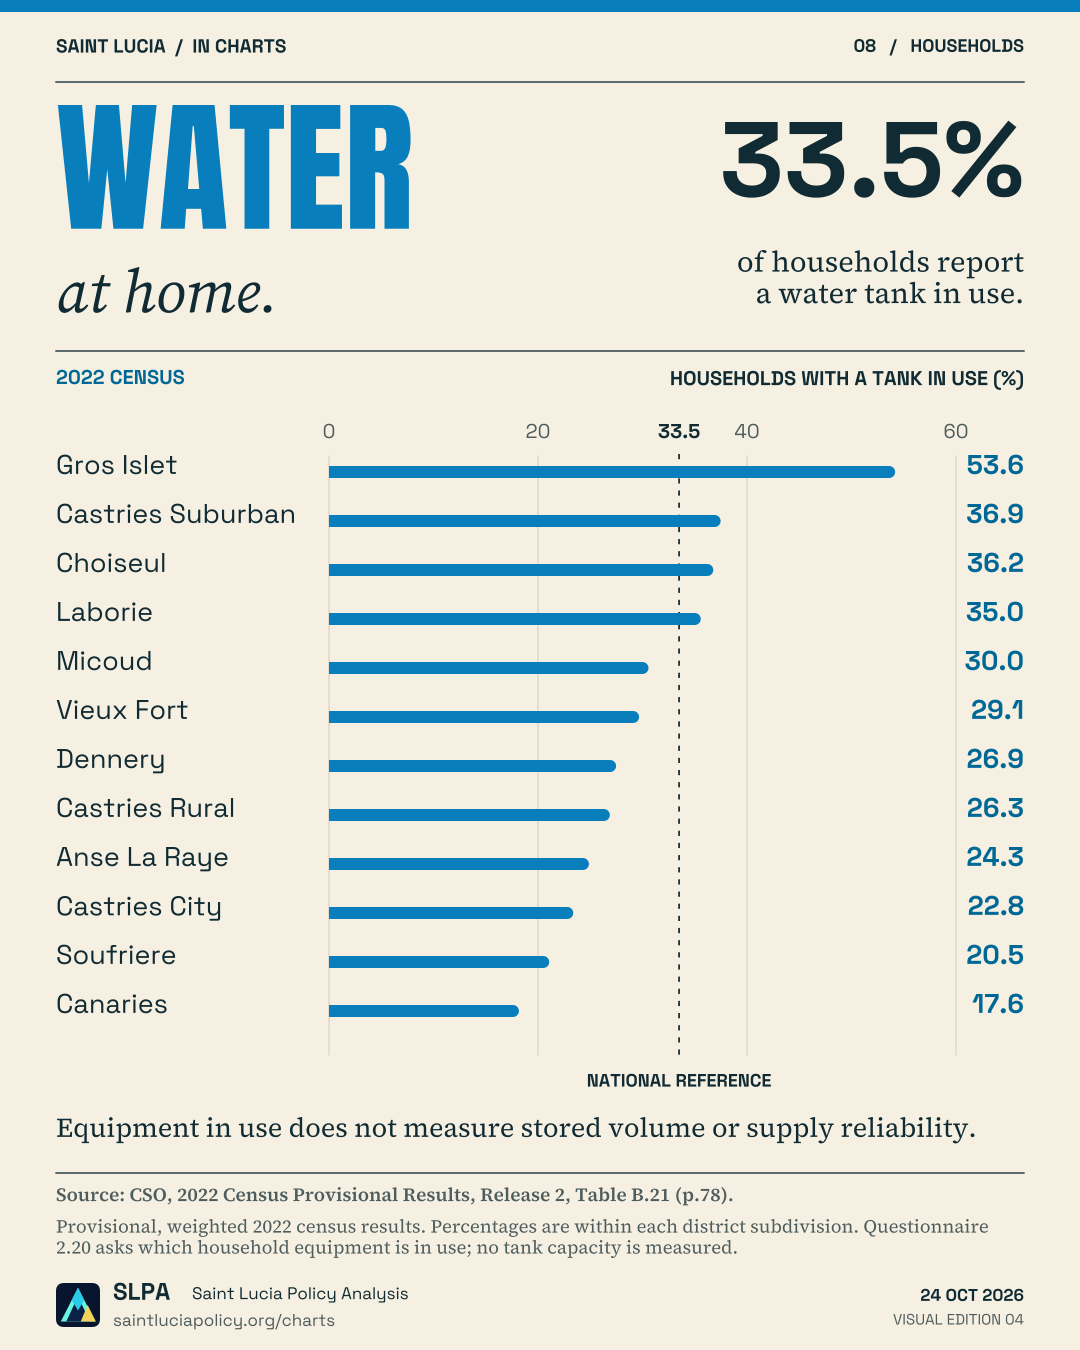
Compare each district on the same percentage scale. The national reference is 33.5%. The district figures are published census percentages, not estimates of how much water was stored.
2022 census snapshot. A tank in use does not establish its capacity, whether it is filled, water quality or reliable supply. These are census districts, not electoral constituencies. The graphic does not rank the quality of public water service.
Explore water service and household costsFollow the evidence
Sources & method.
Central Statistical Office, 2022 Census Provisional Results, Release 2, Table B.21, page 78, Water Tank (%) column. Values below are the published percentages, with no recalculation. The national household denominator is the weighted estimate of 65,951.
The census questionnaire, question 2.20, asks which equipment the household has in use. Water Tank is category 20 in the category list on page 83. Although the report’s table is titled “Ownership”, this visual uses the questionnaire’s more precise wording: a water tank in use.
| Geography | Households reporting a water tank in use |
|---|---|
| Saint Lucia, total | 33.5% |
| Castries City | 22.8% |
| Castries Suburban | 36.9% |
| Castries Rural | 26.3% |
| Anse La Raye | 24.3% |
| Canaries | 17.6% |
| Soufriere | 20.5% |
| Choiseul | 36.2% |
| Laborie | 35.0% |
| Vieux Fort | 29.1% |
| Micoud | 30.0% |
| Dennery | 26.9% |
| Gros Islet | 53.6% |
The census reference night was 12–13 March 2022. Each district percentage uses households in that district as its denominator; Castries is published as City, Suburban and Rural. Geographic weights adjust for census undercoverage. Rounded percentages are not converted into exact household counts.
Equipment in use does not measure tank capacity, stored volume, water quality or supply reliability. The remaining percentage must not be read as households with no storage: refusals and alternative storage arrangements are not separately resolved by this table. This is a 2022 baseline, not a current service assessment.