Work / Data chart
Who is in the unemployment rate?
See who enters the 10.1% calculation, and why the denominator matters.
April–June 2026 · Published 24 October 2026
High-resolution PNG · A4 PDF · CSV data · Edition 04
Reading the visual
What to look for.
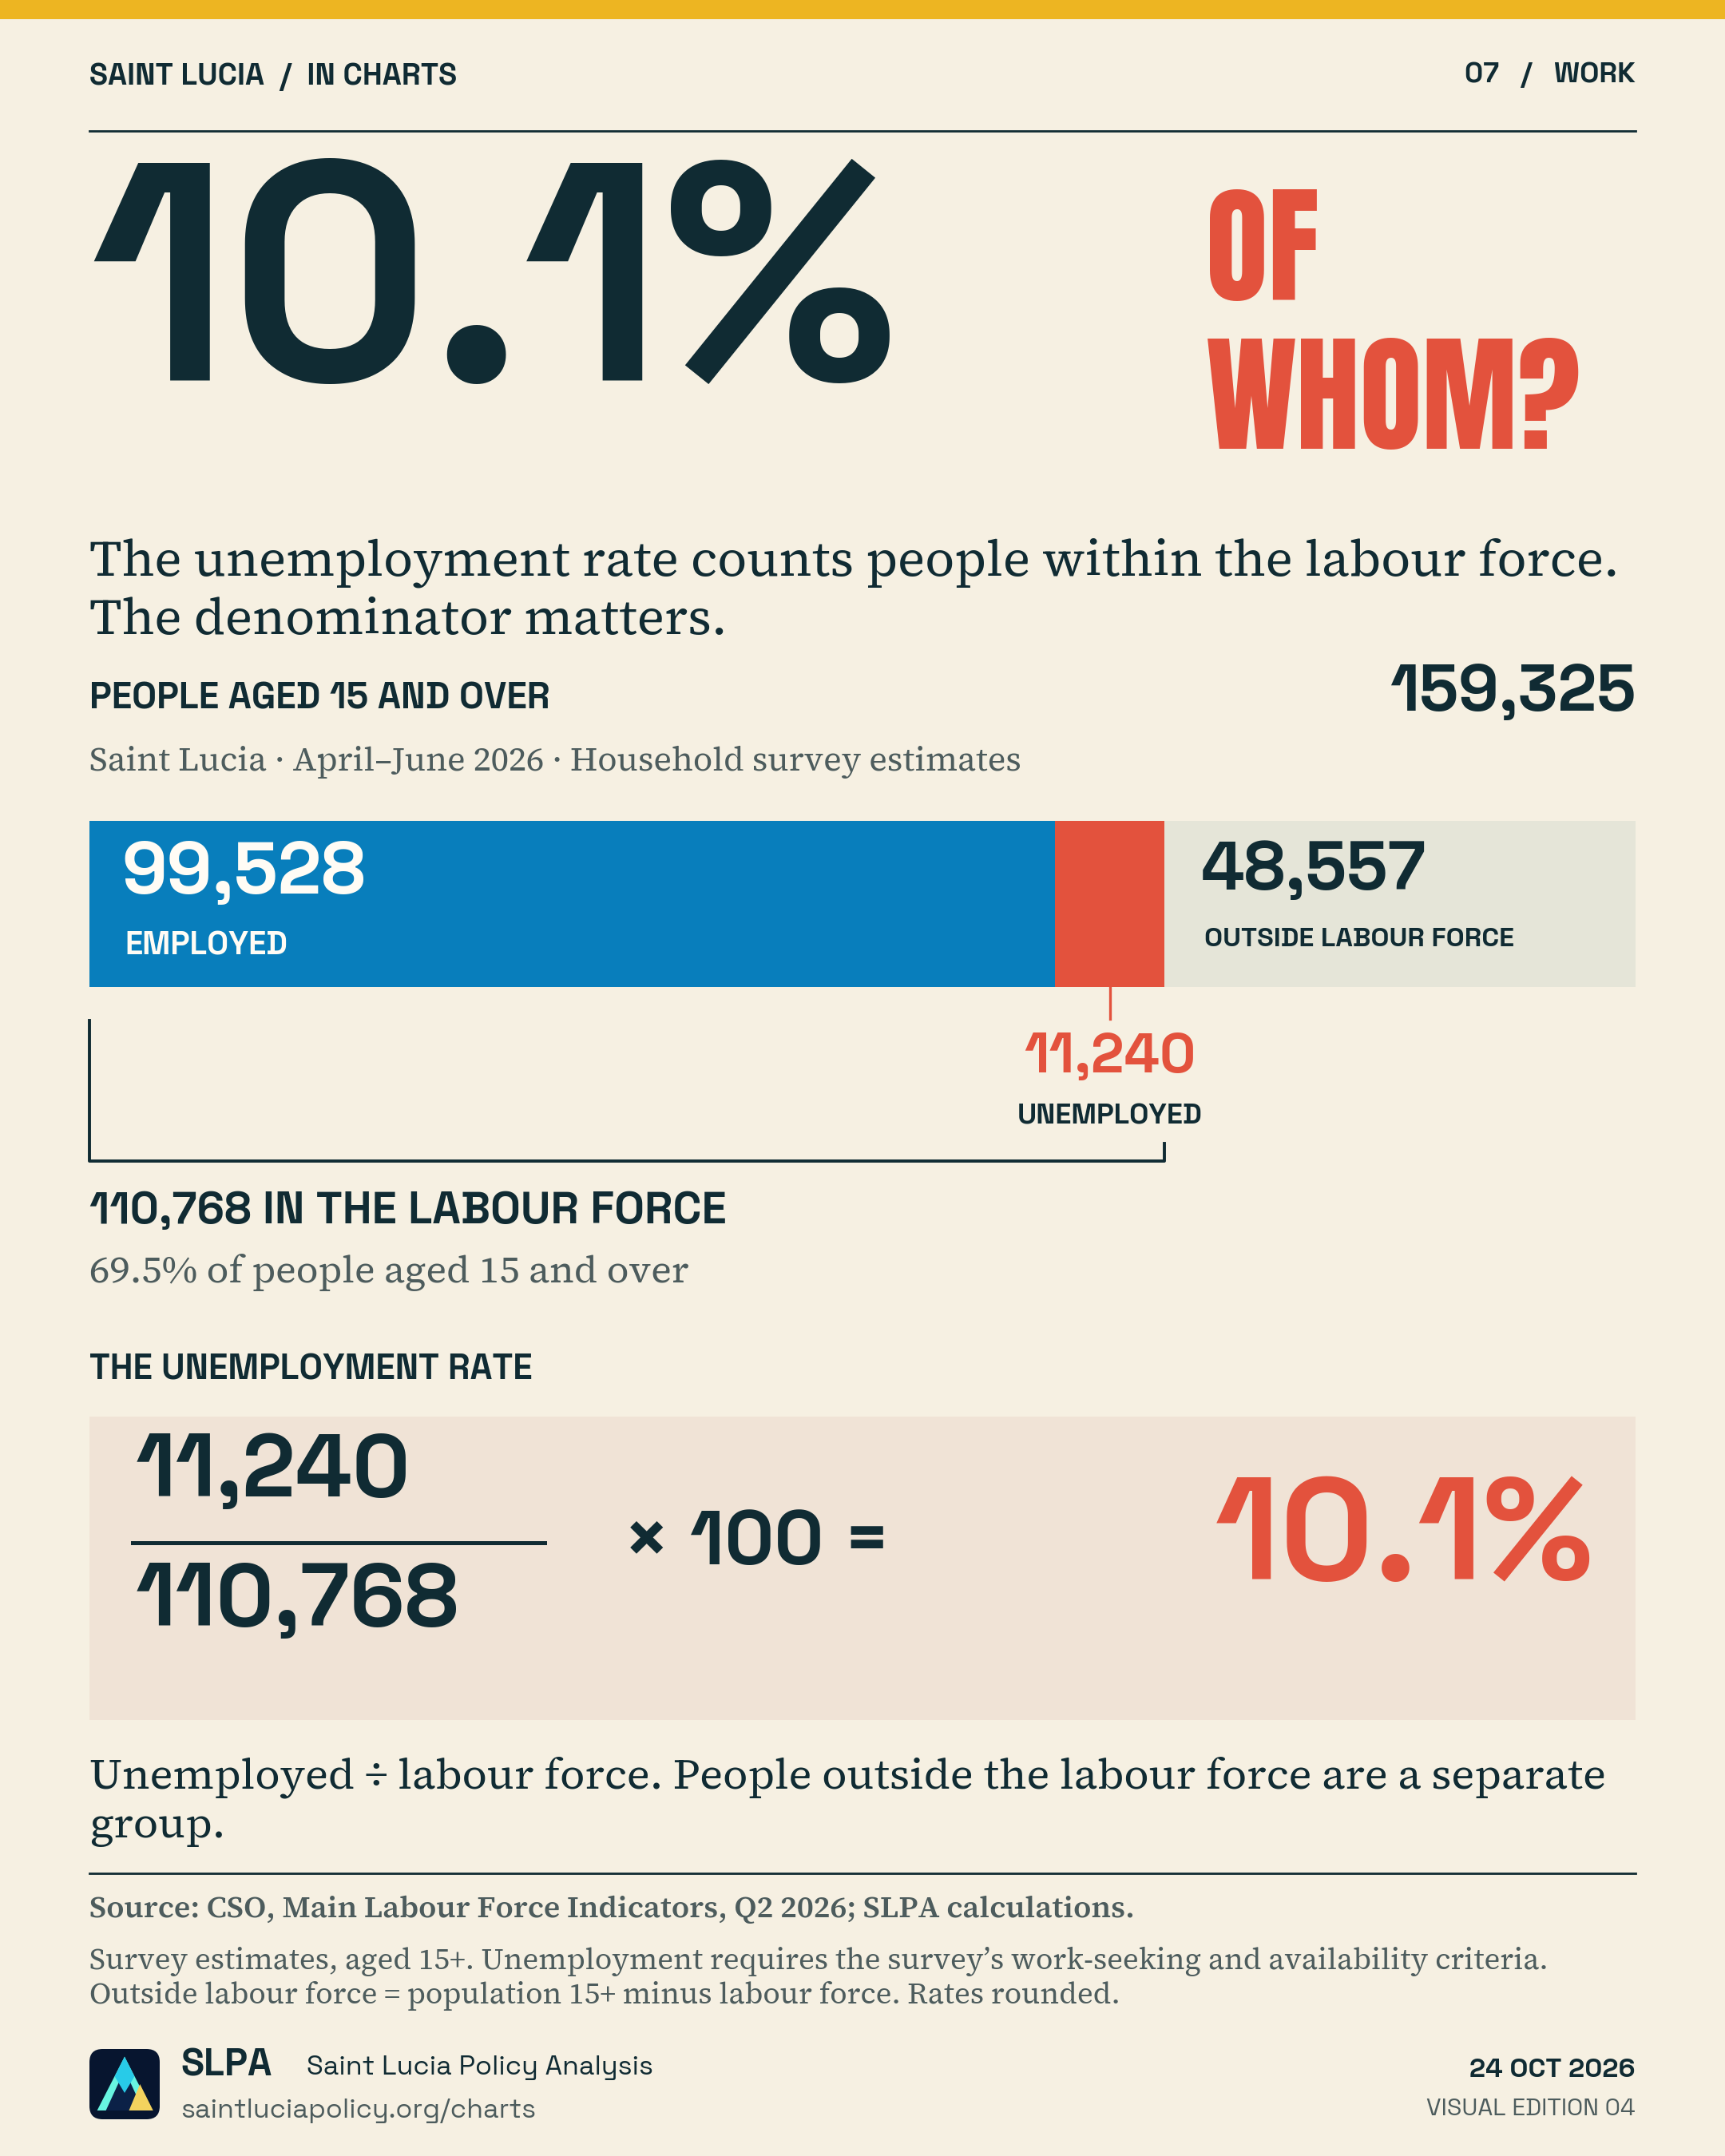
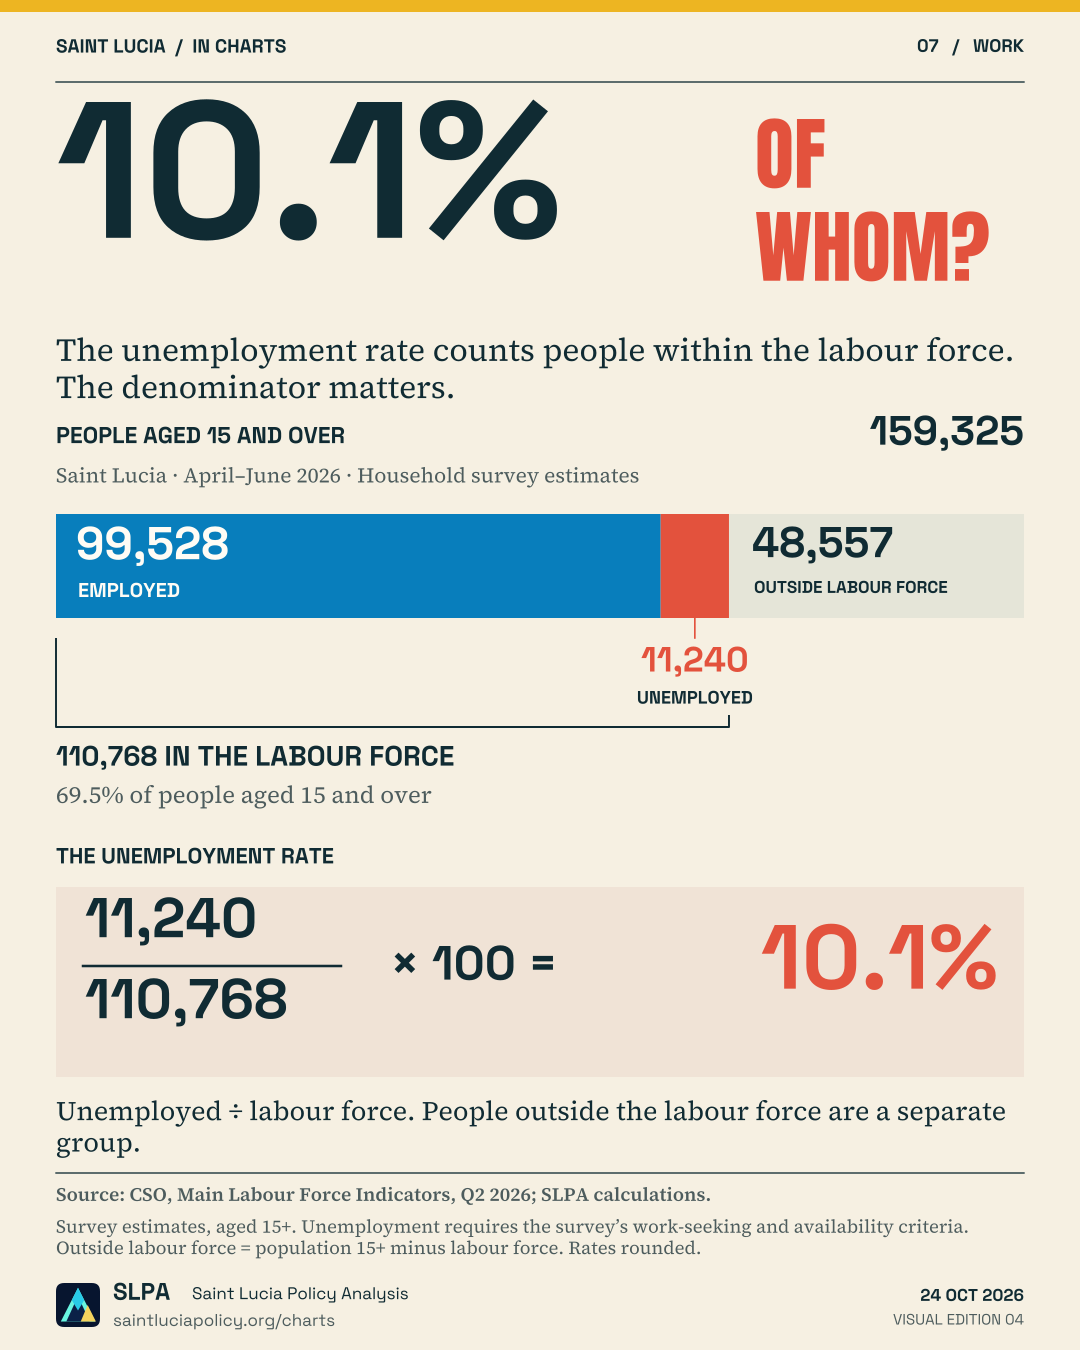
Follow the nested groups. People aged 15 and over divide into the labour force and people outside it. The labour force then divides into employed and unemployed people. Unemployment divides 11,240 by 110,768, not by the whole population aged 15 and over.
Household-survey estimates, not a census or records of individual transitions. Outside-labour-force counts are calculated by subtraction. Employment does not establish sufficient hours, secure work or adequate pay. No sampling interval is supplied with this graphic.
Explore the labour-market explainerFollow the evidence
Sources & method.
Central Statistical Office, Main Labour Force Indicators (Quarterly), 2011–2026 Q2, April–June 2026 column. These are household survey estimates for people aged 15 and over. The table below separates published figures from SLPA’s calculation.
| Measure | People | Source status |
|---|---|---|
| Population aged 15 and over | 159,325 | CSO published estimate |
| Labour force | 110,768 | CSO published estimate |
| Employed | 99,528 | CSO published estimate |
| Unemployed | 11,240 | CSO published estimate |
| Outside the labour force | 48,557 | SLPA calculation |
The labour force combines 99,528 employed and 11,240 unemployed people. SLPA calculates the group outside the labour force as 159,325 − 110,768 = 48,557.
| Rate | Published rate | Calculation |
|---|---|---|
| Unemployment | 10.1% | 11,240 unemployed ÷ 110,768 in the labour force × 100 |
| Labour-force participation | 69.5% | 110,768 in the labour force ÷ 159,325 aged 15+ × 100 |
Unemployment covers people without work who meet the survey’s work-seeking and availability criteria. People outside the labour force are a separate statistical group; this table does not break down their circumstances. Employment alone does not describe pay, hours or job quality. These figures are survey estimates, even where displayed as whole numbers. No sampling-uncertainty interval is shown.